Watch the PE cycle
The broad force behind stock market returns that nobody talks about.
The S&P 500 made a new high last week. The economic expansion has stretched to a full six years this month despite five recession scares in the last three. The always-bullish consensus feels vindicated. This is exactly the kind of environment where awareness of the PE cycle matters most, because it is the one framework that could prevent someone from marching off a cliff in the name of “stay the course.”
Last spring, I published a piece called The Stock Market Supercycle Is Turning. It argued that the stock market was entering an extended period of poor performance based on a decade-plus lasting cycle in price-to-earnings ratios. Part of that piece was wrong. I predicted a recession within months and called the February 2025 high as the peak. That didn’t happen. While recessionary conditions accumulated through most of 2025, the sheer force of a 6% peacetime procyclical fiscal deficit continues to buoy the economy. I wrote about that in The 6% Deficit Post-Lore Economy last December.
But just because it hasn’t happened yet doesn’t mean all-clear. Time marching forward only increases the chances that the PE cycle turns. I think it will be in the next year or two, and despite that non-specific timing, the PE cycle is important to understand and monitor.
I used to call this the “supercycle.” While more economically precise (a cycle spanning multiple business cycles uses the latin prefix super in common economic usage), the term sounds like a setting on your washing machine. A more descriptive name is simply the PE cycle: the decade-plus primary trend in price-to-earnings ratios. It is a crucial force in long-term equity returns, and you’ve probably never heard of it. I’m not the only one to write about it. My knowledge of the concept stems from Lance Roberts and from Robert Kessler, my mentor, who tried to make a living selling stocks during the 1966-1982 contraction. It was central to his thinking because his professional life included it. But the PE cycle rarely shows up in the research, training, or academic work that shapes how the industry and investors think about markets. It’s not hidden. It just threatens the story the profession needs to tell, so it never gets passed along.
What the PE cycle looks like
The chart below shows 126 years of S&P 500 real total returns (over inflation, dividends reinvested) on top, with the CAPE price-to-earnings ratio in the middle and the dividend yield on the bottom. Returns are shown in real terms because nominal returns mask the 1966-1982 period, where inflation created the illusion of progress while investors went nowhere for 16 years.
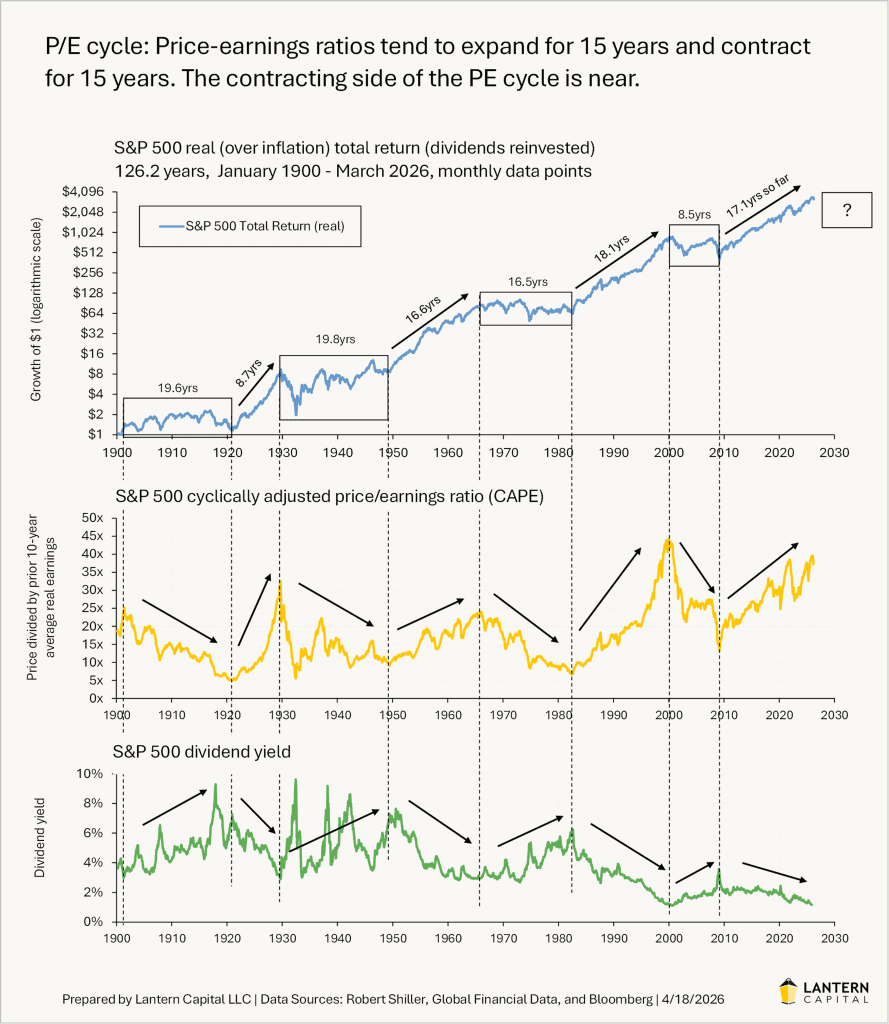
The pattern is striking. The market alternates between long periods of expansion (arrows) where prices rise steeply and consistently, and long periods of contraction (boxes) where prices go sideways with violent swings in between. These aren’t random. They are driven by the PE ratio trending in one direction for roughly 15 years, then reversing. The CAPE ratio and dividend yield are mirror images of each other: when investors are on the magic carpet ride up, they don’t think about dividends. When prices aren’t rising, dividends become a major reason to own stocks.
The expanding and contracting phases last almost exactly the same amount of time on average. Expanding periods have averaged 15.1 years. Contracting periods have averaged 16.1 years. Half of one’s career is spent in one regime, half in the other, and they feel completely different.
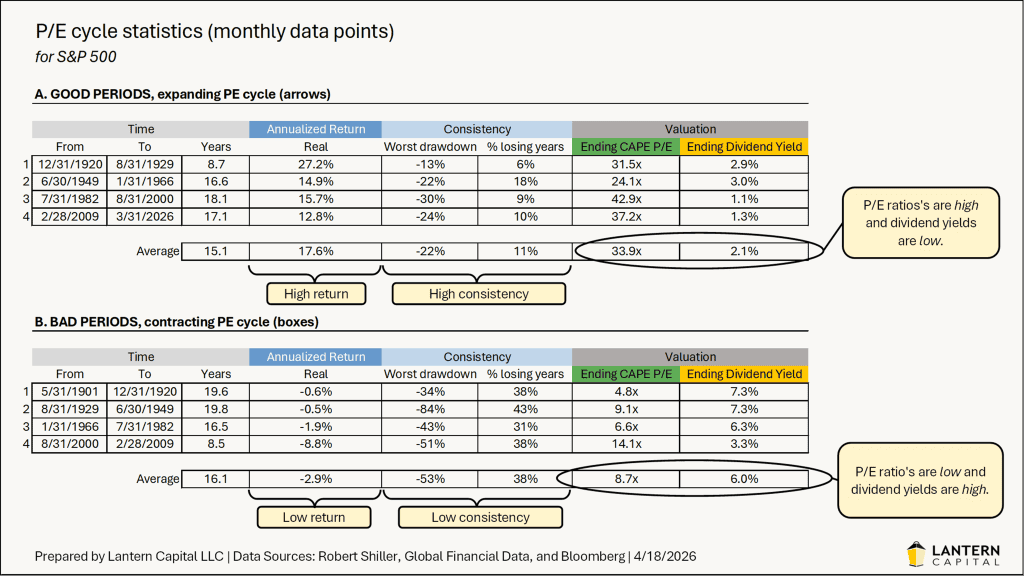
During expanding periods, annualized real returns have averaged 17.6% with worst drawdowns averaging 22%. Only 11% of rolling 12-month periods were negative. During contracting periods, real returns have averaged -2.9%, worst drawdowns averaged 53%, and 38% of 12-month periods, investors were sitting in a loss. That is not a minor difference in degree. It is a completely different experience. Stock selection, sector rotation, and the other tools equity professionals spend careers on matter, but they are operating inside a much larger force that determines most of the outcome.
A sharp reader will notice that the last contracting phase lasted only 8.5 years, well short of the 16-year average, and turned with a CAPE of 14.1x, much higher than the single-digit levels that ended previous contractions. The PE cycle was likely cut short by the advent of quantitative easing in the US, launched on 3/18/2009, nearly coincident with the S&P 500’s trough nine days earlier on 3/9/2009. Modern ways to add stimulus to the economy can shorten the contracting side and lengthen the expanding side (as appears to be happening now), but they don’t eliminate the force underneath. Monetary and fiscal stimulus presents opposing vectors to account for, not a cure.
This is further obscured because two idiosyncratic events during that short contraction, the dot-com crash and the Great Financial Crisis, leave many to think that if you can avoid those specific events, you can avoid the negativity in markets. But they are cycle exhibits masquerading as causes. Whether it is the business cycle or the PE cycle, cause-seeking after the fact leaves investors believing that people have control over the levers, that past mistakes can be prevented from recurring. It is a very dangerous idea, and it keeps showing up from economists and professionals trying to fix more than is fixable. Efforts to mitigate economic negativity don’t obviate the downward force. They just create an opposing vector that must be sustained to work.
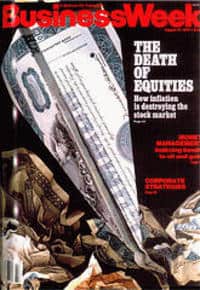
The BusinessWeek test
On August 13, 1979, BusinessWeek published its famous cover story, “The Death of Equities.” After 13 years of a contracting PE cycle, the magazine concluded that stock market weakness was a “near-permanent condition.” Two years later, the longest and second-highest-returning expansion on record began: 18.1 years at 15.7% annualized real returns. The profession’s consensus at the bottom was that the bottom was permanent.
The same psychology works in reverse. After 17.1 years of an expanding PE cycle, today’s consensus is that stocks always work over time, that any dip is a buying opportunity, and that permanent allocation to equities is the only rational strategy. The BusinessWeek cover is a reminder of how wrong consensus can be at extremes. The crowd doesn’t miss the turn; the turn isn’t on anyone’s radar.
Why it happens
The PE cycle is not just a statistical regularity, and it isn’t an accident of idiosyncratic events. It has a mechanism. It takes roughly 15 years for one generation’s hard-won experience to be fully replaced by the next generation’s inexperience. A young investor in 1982 had never seen a PE expansion. By 2000, that investor was running money, fully conditioned to expect that valuations always go up. The scar tissue from the prior contraction had healed completely, and the people who carried it had retired or been replaced.
Behind the psychology, there is also arithmetic. The PE ratio can’t rise or fall forever. Equities always compete against T-bills (cash). At a CAPE of 37x and a dividend yield of 1.3%, and without sustained price appreciation, a 3.5% risk-free rate looks attractive. At the other extreme, a CAPE below 10x and a dividend yield above 6% is the mechanism to draw capital back from cash even without recent exciting price action. Sentiment sets the trend, but the stock market’s competition with cash helps set the boundaries.
Where are we now
The current PE expansion is 17.1 years old as of March 2026, already longer than the 15.1-year average. That does not mean it ends tomorrow. Two forces are extending it beyond its natural life. The first is the 6% peacetime procyclical fiscal deficit, which is stretching the entire business cycle into the slowest on record, and what stretches the business cycle tends to stretch the PE cycle with it. The second is artificial intelligence. Historical PE cycle peaks often coincide with technologies that have already been fully adopted and fully priced: railroads by 1901, radio stocks by 1929, the internet by 2000. AI is not there yet. Data centers are still being built, adoption is still accelerating, and most importantly, the models are getting more and more helpful. The expansion probably doesn’t end while this new technology is still in its adolescence.
I’ve been writing about this cycle since 2021. My timing has been wrong. The expansion didn’t end when I thought it would, not in 2021 and not in 2025. That experience has clarified something important about how this framework should be used. The PE cycle is not a tool for calling the top of the market next quarter or even next year. It is a tool for understanding the regime your long-term investments are operating in. The same financial planning industry that builds portfolios around 20-year horizons should find a 15-year cycle directly relevant to that work. This is a timing tool, but only to the extent that an expected holding period matches the rough precision of calling the turn in the PE cycle.
It’s also worth noting that the PE cycle doesn’t necessarily need a dramatic event to turn. When the contracting phase began in 1966, there was no crash and no recession. The market just quietly stopped making real progress for 16 and a half years. The period’s worst drawdown came later, in 1973-74, seven years in. At the start, it looked like a normal pullback in an ongoing bull market. Anyone waiting for a 1929 or 2000 moment as confirmation that the turn has arrived may not get one.
My updated view is that the expansion side of the PE cycle may extend another one to two years before the contracting side begins; because the deficit has essentially slowed this cycle like molasses. That is not a reason to be complacent. It means the turn is likely within the planning horizon of anyone making long-term allocation decisions today. When it arrives, the historical pattern suggests a decade or more of flat real returns, “lose half your money” drawdowns, and a stock market that punishes buy-the-dip thinking instead of rewarding it.
This is not a piece many want to read, but the PE cycle will eventually make itself known regardless.