AI isn’t carrying this cycle, the deficit is
We all feel it
We’ve all watched unusual buoyancy in equities for years. The stock market keeps absorbing more bullets than it should withstand. Bank failures, tariff shocks, private credit, Iran, recession scares, the data going soft, the Fed pivoting, unpivoting. Stocks higher through all of it.
In 2023 and 2024, the word to describe this was US exceptionalism. The US was pulling ahead of its rivals (the EU and China) because the US was “exceptional.” That was embarrassing as an American. Now it’s resilience. Jerome Powell uses it. John Williams uses it. The FOMC minutes use it.
But the phenomenon is more than a feel. A review of rates and the economy shows it directly:
● The yield curve inverted for the longest stretch in modern history (7/2022 – 8/2024, 10yr minus 2yr) and has now de-inverted. No recession this time.
● The Conference Board’s Leading Economic Index fell more than 2% below its prior peak in late 2022 and is now 19.1% below its peak. No recession so far.
● The Sahm rule triggered in September 2024 (August data), one of the most reliable recession indicators. No recession this time.
● Five of the six NBER monthly recession indicators went negative concurrently in mid-2025. No recession this time.
● 3mo. average payroll growth went below zero last year. No recession this time.
Each of these has a strong record of predicting or confirming recessions. All have come and gone without one.
The 2-year Treasury yield, which has the highest correlation to the business cycle of any investable asset, has refused to fall the way it usually does. Every time the data weakened and the market priced in cuts, the 2-year would dip, the economy would recover, and the 2-year would lift back up, reversing out the cuts priced-in. Each time the bond market priced in what normally would’ve come next, a recession, but had to reverse it.
We all feel it. We can measure it. The Fed calls it resilience. Some called it exceptionalism. Nobody tells you why.
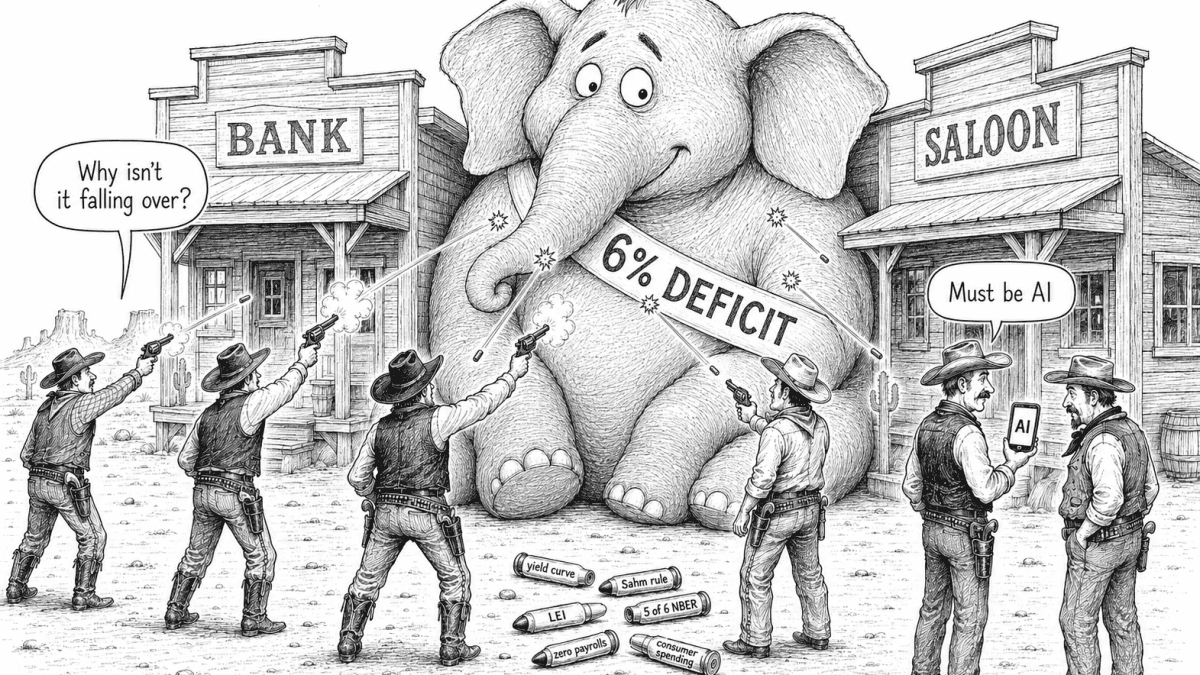
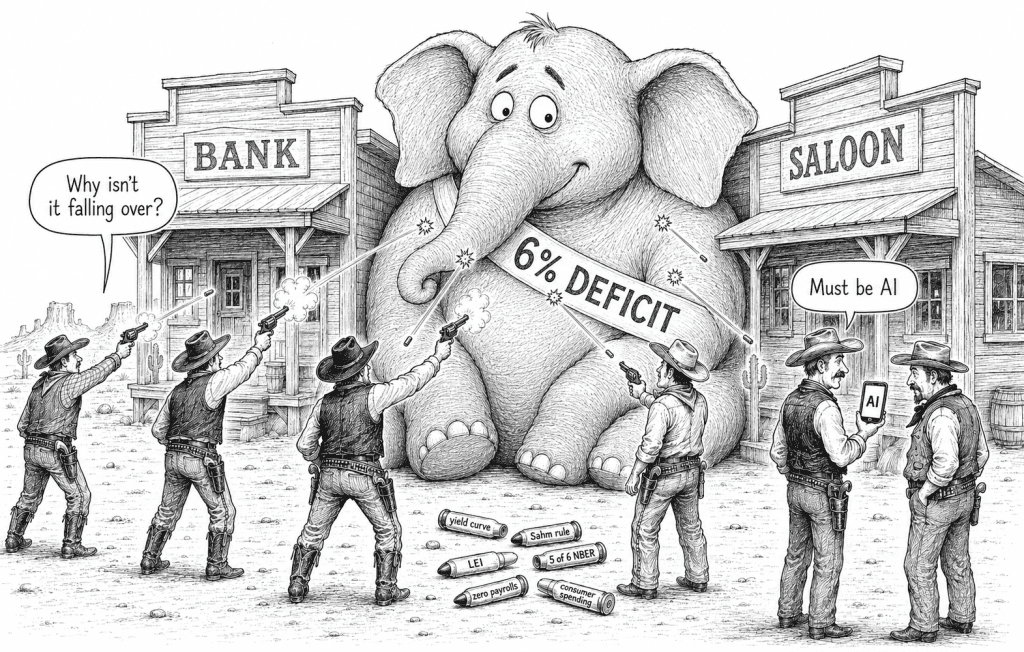
It’s the deficit, the elephant in the room
Quietly assumed for a while, now the consensus is openly reaching for AI as the answer. Last week, John Williams, President of the New York Fed, told reporters after a speech in New York City: ‘no question AI is driving a massive, long-lasting boom’ (Bloomberg, May 4). The cycle is resilient, the argument goes, because AI capex is unprecedented, AI adoption is rapid, and AI productivity is around the corner. Nearly everyone is watching AI transform their lives, making it a natural answer. People are hungry to see an economic effect from this biggest story in the newspaper and a topic consuming the zeitgeist.
But, once it is measured and compared, AI is dwarfed by the deficit. In other words, exceptionalism and resilience are bought and paid for. (The related question of why yields haven’t risen more is in the addendum.)
For the last 10 years, the U.S. fiscal deficit has averaged 6.4% of GDP and 6.1% over the most recent 3.8-year pro-cyclical peacetime portion. For the 85 years before that, back to the inception of the data (1930), the average was 3.1%. And the comparison is generous to the recent decade. The 85-year prior is loaded with war spending. The last 10 years haven’t had that.
The numbers got this big because both parties spent freely when they had the votes, plus an over-stimulated pandemic on top. Together, the last decade’s deficit has been shockingly large (bracketed period in lower right-hand corner of chart below).
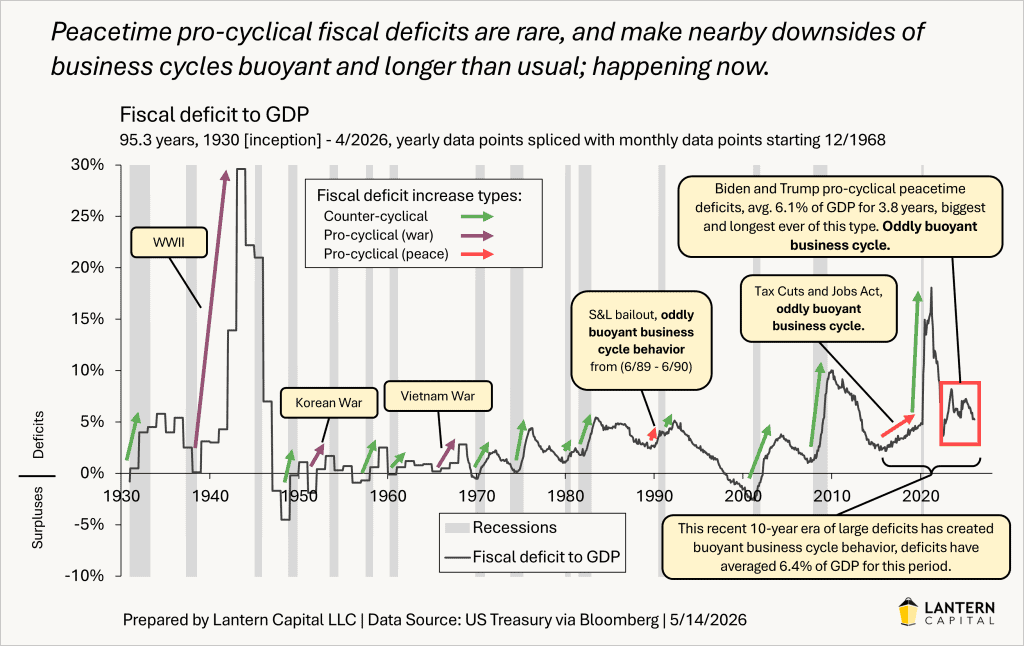
The chart above classifies every meaningful deficit increase by type: green for counter-cyclical (deficits opened during or after a recession), purple for pro-cyclical war (WWII, Korea, Vietnam), and red for pro-cyclical peace (deficits that grew while the economy was already expanding). Peacetime pro-cyclical deficits are rare. Three in 95 years. The current one, averaging 6.1% of GDP for 3.8 years, is the biggest and longest peacetime pro-cyclical deficit ever. Each of the three had measurably slow business cycles. The economy in the S&L period absorbed a recession scare in mid-1989, bought a year of recovery, and finally turned over in mid-1990. The 2018-2020 period had a brief yield curve inversion, softening indicators, and Fed easing without a recession arriving, until the pandemic ended the cycle exogenously. And this one, the slowest of all.
Two measurements show why the deficit, not AI, is doing the bulk of the work: timing and magnitude. This piece is the third in a series on the deficit and the buoyant cycle. For additional context, the earlier pieces are The 6% deficit, post-lore economy (12/2025), and The Slowest Business Cycle on Record (2/2026).
Timing
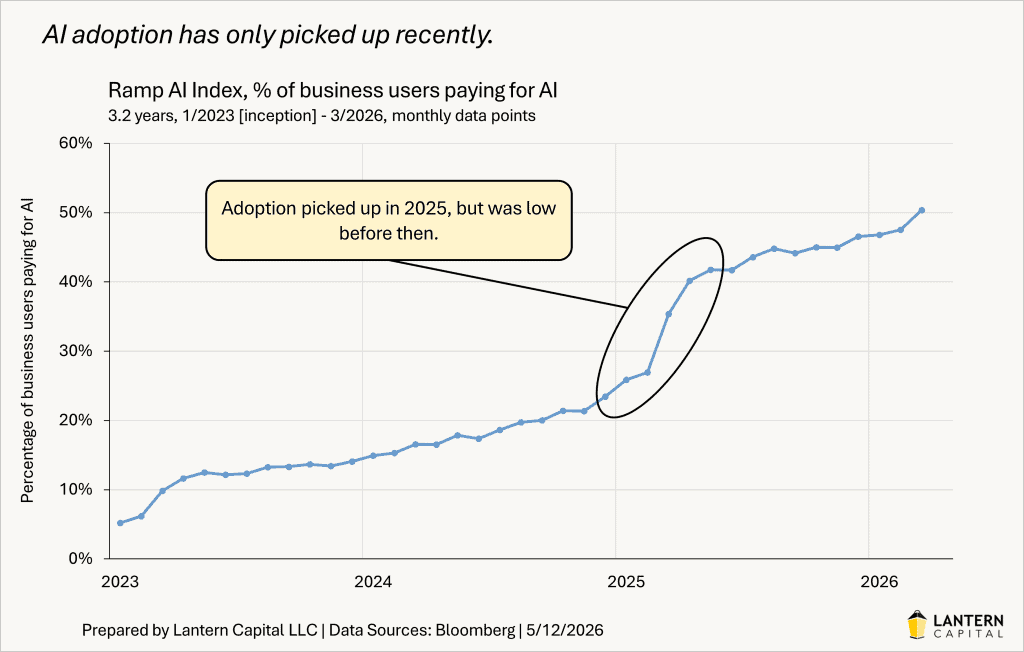
The Ramp AI Index tracks AI adoption among U.S. businesses through actual transaction data. Adoption was 5.2% in January 2023 and still under 20% through August 2024. It only reached 50.4% by March 2026. The steep part of the curve is the last 12 to 15 months. The AI build-out started earlier, but the adoption that would translate into measurable productivity is recent.
The cycle has survived five recession scares since late 2022: the post-COVID scare, the SVB and Credit Suisse aftermath, the late-2023 data dive, the summer 2024 Sahm rule trigger, and the May-through-December 2025 labor fear episode. Four of those five were recovered from before AI adoption was material. The fifth coincided with adoption climbing from 42% to 47%, but the cycle had already absorbed four scares without AI.
The deficit fits like a glove with five fingers.
Each scare was recovered from while the red box in the first chart was sitting at 6%+. The 6% deficit up vector, sustained for 3.8 years in an expansion, explains why the economy recovered so easily without the hundreds of basis points of Fed cutting usually needed to mitigate a recession.
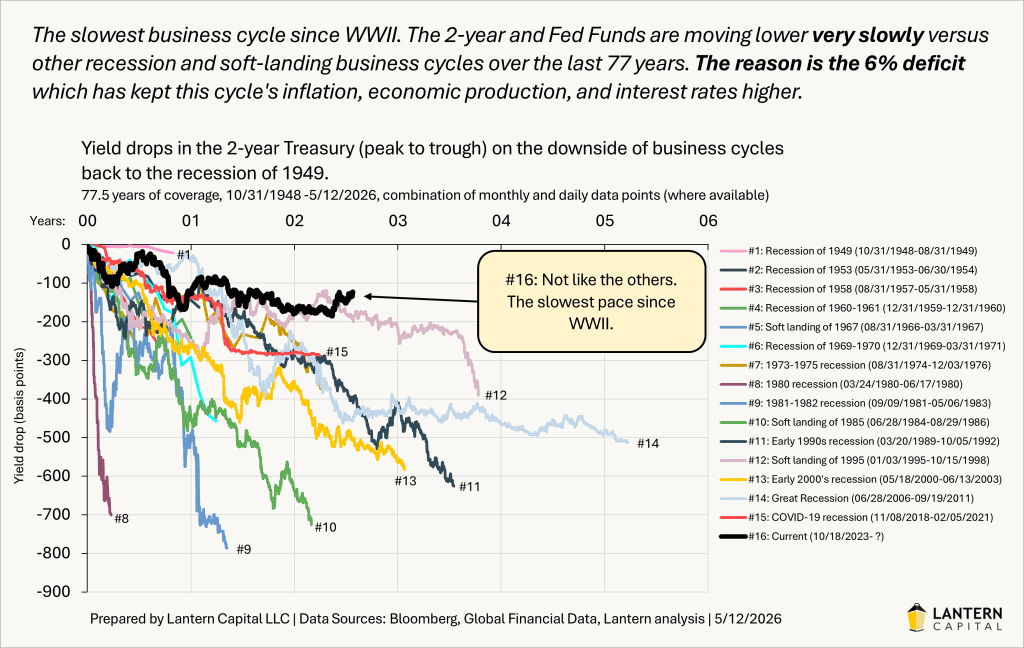
Sixteen cycles back to 1948. The current cycle has the slowest pace since WWII, with the 2-year having fallen only about 135 basis points in 2.5 years versus the typical 400 to 700 basis points by this point. The deficit has been pushing against the cycle’s downside the entire time, slowing what would otherwise be a normal yield decline.
AI doesn’t explain that pattern because it wasn’t there for most of it. The deficit explains every single one, by being there for every single one.
Magnitude
Earlier this year, the St. Louis Fed estimated AI’s contribution to real GDP growth at 1.0 percentage points annualized over the first three quarters of 2025, about 39% of total real growth (Rubinton and Patro, Tracking AI’s Contribution to GDP Growth, January 12, 2026). Applying the same methodology to nominal GDP produces the yellow line in the chart below. Rubinton herself has noted that this approach likely overstates AI’s true contribution, since not all software, R&D, and IPE spending is AI-related. Even at this conservatively high estimate, AI’s average contribution over the 3.8-year window is 0.7 percentage points annualized, 1.26 pp over the most recent four quarters when adoption climbed sharply, and its peak quarter is 1.71 pp in Q1 2026.
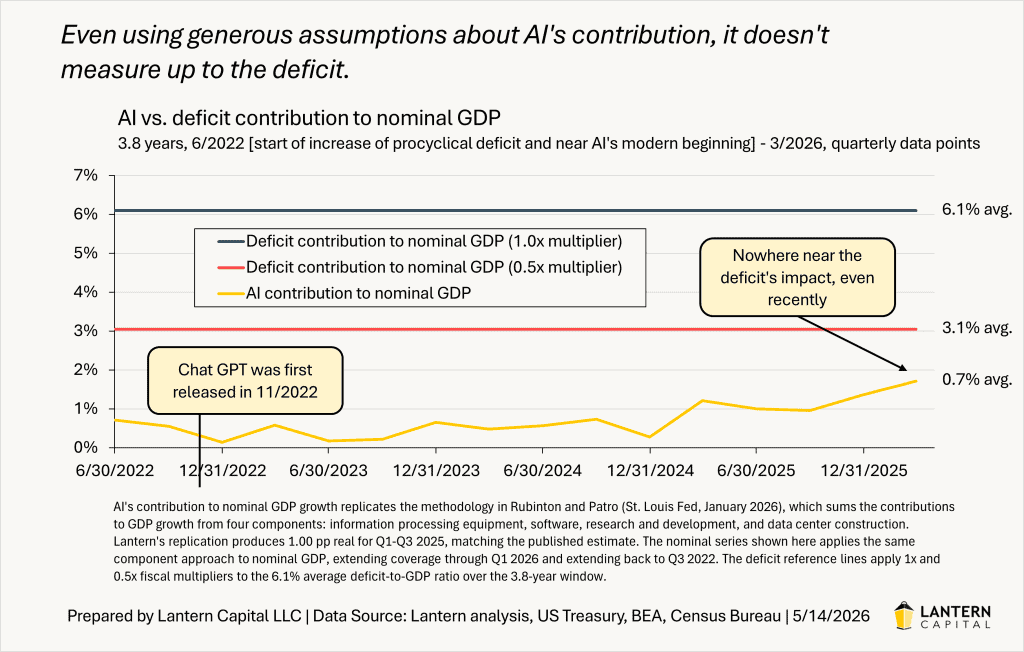
The deficit’s size is known. Its precise impact on the economy depends on multiplier assumptions that are contested, but the deficit is large enough on its own. At a 1x fiscal multiplier, the deficit’s contribution to nominal GDP growth is 6.1 percentage points annualized, roughly nine times AI’s average contribution and more than three times its peak. Even at a 0.5x multiplier, the deficit’s contribution is more than four times AI’s average and nearly twice its peak. At any plausible multiplier, the deficit dwarfs AI.
The point is that the deficit’s contribution is large and persistent enough that one has to actively explain it away to make AI the dominant force. The deficit was there first. But the field isn’t refuting the deficit’s role, it’s ignoring it.
The elephant has been in the room the whole time
Fiscal spending is a legitimate up vector on the economy, a simple Econ 101 idea that has been forgotten in favor of more dramatic narratives. While most are captured by the question of whether deficits this size are sustainable, they’ve forgotten that the deficit provides economic stimulus too. The deficit’s upward impact on the economy raises the threshold for how bad things need to get before the self-reinforcing part of a recession takes over.
But that isn’t inoculation, it is mitigation. Eventually the elephant will fall over. Fiscal support doesn’t stop self-reinforcing recession dynamics once they’ve been triggered. We got pretty close to that last summer. It only delays them. When the turn comes, AI valuations will reset along with everything else, regardless of how transformative the underlying technology proves to be over a longer horizon. That’s how cycles work. The deflation of a speculative episode is a market event, not a verdict on the technology.
Despite the deficit and an expectation for its size to continue indefinitely, the runway on this cycle is finite. The deficit can be expected to continue at this scale for at least the next 2.5 years. Current law, current spending baselines, and the OBBBA tax cuts are locked in through the January 2029 inauguration. Beyond that, the trajectory depends on the 2028 election and subsequent fiscal choices, but the CBO baseline projects the deficit growing from 5.8% to 6.7% by 2036 under current law.
My expectation is that rates rise into mid-summer, triggering the next recession scare. Whether that scare is absorbed or whether it triggers self-reinforcing dynamics will determine how long this expansion has left.
For now, the right way to read the data is to keep one eye on the deficit’s continuing push and another on the Lantern Daily Economic Index (LDEI) for when the underlying economy starts to give. Don’t forget the elephant; the slow, structural, bipartisan fiscal force standing in the middle of the room. It is almost never discussed as a positive vector on the economy, and 95 years of history says we have never tried to run this big or this long in peacetime before.
Addendum: Why fiscal isn’t driving yields
Some ask, if the deficit is so big, why haven’t Treasury yields risen more? Markets often predict things they want to happen, not what will happen. I call these ‘narratives of desire.’ This is one of them: a narrative built on hopes to force federal spending cuts.
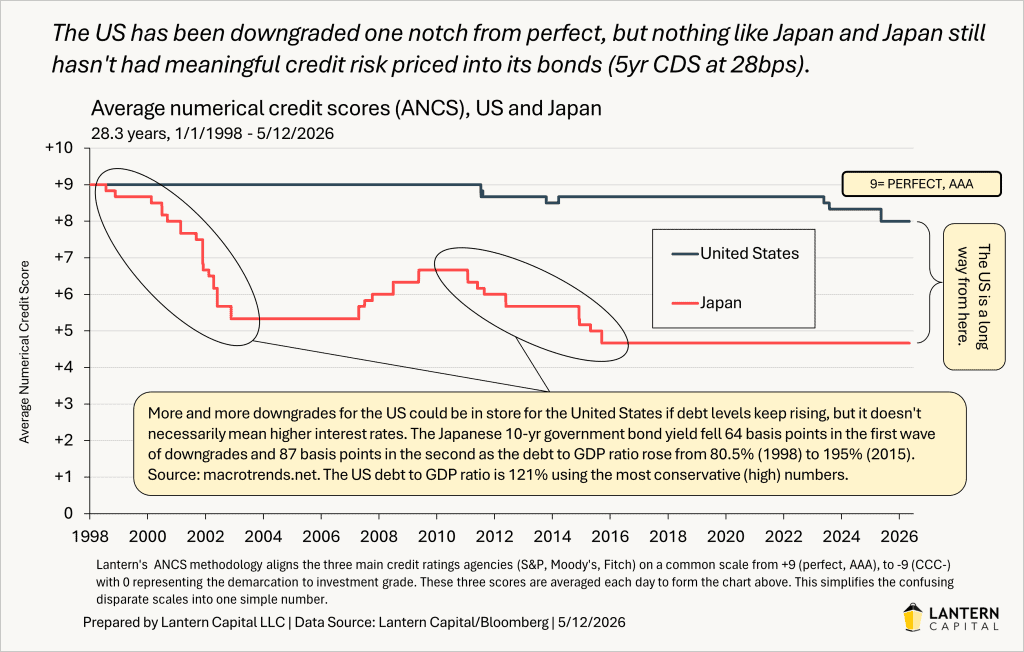
The US is nowhere near pricing in credit risk for three reasons. First, debt service to GDP, not debt to GDP, is the constraint that has historically driven sovereign borrowing costs, and the US at 3.2% is well below the thresholds where that has bitten. Second, the US has only been downgraded one notch from perfect against Japan’s four notches without a yield crisis, at debt levels far higher than in the US. Third, despite being slow, the primary trend for rates is lower since 10/2023, and the cycle is about a third of the way through (using yield curve steepness to mark progress, flat=early downside, steep=late downside). I expect yields to keep coming down slowly over the next two years and this will eventually take pressure off of the debt service to GDP measure, just like what happened from 1995-2000. For the full case, see my Special Report: U.S. Treasuries and the Fiscal Situation. And from last year’s Moody’s downgrade fiscal scare with Lantern’s ANCS framework, see U.S. Downgrade in Context and Yield Effect: Probably None.