
Great calls

I’ve gotten an exceptionally high number of predictions right over the last two years since I started posting publicly. I put more emphasis on measuring macro-economics faster (LDEI, more on that at the end) and less on hot topics and micro-economics than most. I always try to make things simple and reconcilable to what I’ve said before. I’ve spent 25 years obsessively researching what matters and what doesn’t, leading to these calls. A list of them follows, with an explanation, and a quote (in italics) from the relevant writing.
1. Expecting cyclical Treasury yield peaks, 10/18/2023, “Views From the Top”. Published on the day of the cyclical yield peak for the 2-year Treasury, the rest of the yield curve peaked the following day. In this writing, I compared the rising yield movement and sentiment to other cyclical yield peaks since 1950 to show that the current hysteria was normal and a weaker economy always brought yields back down. Treasury yields fell through January 2024 upon weaker economic data and have been slowly ratcheting lower (more at the short-end of the yield curve than the long-end) since then. This first leg of the bond-bullish primary trend call was further supported on 11/2/2023, 12/4/2023, 12/8/2023, and 12/14/2023. I think Treasury yields are still within this primary trend of lower interest rates.
Fiscal deficits and quantitative tightening are some part of the Treasury pricing equation, but they pale in comparison to the Treasury market’s North Star; the outlook for inflation and real activity. Their reappearance lately is from reaching for reasons for higher rates, not from evidence they are the cause. It is remarkable how similar the Treasury market conversation has been over the last 75 years through wars, deficits, secular inflation, and secular disinflation. It doesn’t mean that interest rates have peaked in this cycle; they are making new cyclical highs as I write this. But, with the Fed becoming determinedly neutral in the face of strong economic data, the yield curve de-inverting after a huge inversion, the stock market now weakening, and Leading Economic Indicators falling for 17 straight months, the bond market is in the vicinity of a peak.
2. There won’t be post-pandemic secular inflation, 11/28/2023, “It Won’t Be A Repeat of the 1970’s” Also, on Advisor Perspectives. Many ideas were proposed after the pandemic to suggest inflation would be secularly higher such as green investment, friend-shoring, and labor shortages. This article explained why the current period is structurally different than the 1970’s and secular inflation would remain low. Inflation has trended lower since.
The pandemic’s supply-chain failure and panicked fiscal and monetary response that “over-filled the hole” undoubtedly created high inflation and called many economic dynamics into question—usually with an inflationary conclusion. But, the inflation surge of the last two years may be an isolated event. The two big factors that have kept inflation and rates low for decades remain: aging demographics and globalization. For these reasons and the others explained above, inflation is not set to rise like it did in the 1970’s.
3. Wars don’t necessarily mean higher yields, 11/7/2023, “Wars and Treasury Bonds.” The Russia-Ukraine and Israel-Gaza wars sparked fears of wider war and inflation. This was a study of the 10-year yield back into the 1800’s to show that wars occur during periods of higher and lower rates. Current wars have yet to materially impact US inflation or Treasury yields.
With the Israel-Hamas conflict escalating along with the ongoing Russia-Ukraine war, there is concern of wider war. War is inflationary, but Treasury yields don’t necessarily rise during them because there are often bigger forces at play such as the business cycle, secular trends in inflation, or yield curve control.
4. Expecting Treasury yields to rise, 1/2/2024, “The bond market has gotten ahead of the economic data.” Economic data improved towards the end of December 2023, splitting from how dovish the Fed sounded. I thought yields would begin to rise because of it. Treasury yields rose through the end of April 2024. This bond-bearish secondary trend theme was further supported on 1/17/2024, 1/29/2024, 2/28/2024, 3/14/2024, 4/10/2024, and 4/26/2024.
…as the Fed becomes more vocal after the holidays, unless the December economic data (released this month) is as negative as October’s, the Fed will likely continue to retract some of the December meeting’s dovish impression and it will dawn on the market that a March rate cut is not as certain as it is priced for now (76% chance.) I expect interest rates will bounce somewhat higher before they resume falling again.
5. Expecting Treasury yields to fall, 5/15/2024, “Economic data weakens further.” Economic data began to turn lower at the end of April of 2024. By mid-May, I was convinced data had started a new trend downwards which would pull rates down too. Rates fell through mid-September 2024. This bond-bullish secondary-trend theme was further supported on 6/10/2024, 6/12/2024, 7/11/2024, and 8/22/2024.
As I wrote earlier this month (5/3), “I think that the interest rate back-up since January is over if inflation and consumer spending begins to moderate too.” The economic data showed this today. I think Treasury yields made local peaks at the end of last month (2yr @ 5.04%, 10yr @ 4.71%.) and will generally trend lower with Fed cutting expectations moving sooner.
5/3/2024 piece
6. The United States has high fiscal ratios, but not extreme ones, 7/31/2024, “U.S. Treasuries and the Fiscal Situation.” Also on Advisor Perspectives. Fiscal concerns come up in every Treasury market sell-off, usually co-opted from a move started for fundamental reasons to help argue for less government spending. I wrote this piece to go through a bevy of statistics to show that US fiscal risk is not an issue now. This has remained correct; the US Credit Default Swap value is around 40bps (not 100), Treasury term premium is unclear; either falling or rising this year depending on which model you use, and the yield curve is as steep as it should be for this part of the business cycle.
Unquestionably, public debt growth in the U.S. is much nearer to the end of its capacity than its beginning and hard choices will have to be made within years, not decades to reduce deficits. It is disappointing that large deficit spending is now being used during periods of economic strength. Pro-cyclical deficits that aren’t invested for the future (say, infrastructure) bring-forward economic growth that will inevitably have to be paid back. At this point, large deficit spending should be reserved for recessions and emergencies only.
But, outside of the political fracas, U.S. debt fits into a global context that isn’t as dire as it is made to sound. The relentless political/Wall Street narrative that too much supply (deficits) or too little demand will lead to higher Treasury yields has been wrong for decades. Imbalanced deficit fear commentary from the press makes it seem that Treasuries are always or will soon be in a bear market; and frankly, that they aren’t safe. The $35 trillion of capital that owns them would disagree. Given reasonable debt statistics and sufficient buyers, Treasury yields will continue to be driven by the outlook for the economy, which makes them the asset with the most opportunity from a slowing or receding economy.
7. The Sahm rule was triggered but a recession isn’t here, 8/2/2024, “Moving too fast” Many thought a recession had started in August 2024 because the Sahm rule triggered and several interest rate cuts were priced in as a result. I didn’t think so.
The Sahm rule, which triggered today, suggests the economy is already in recession by history but it is clearly not. The Conference Board’s Coincident Indicator series needs to make a peak to signal the top of the business cycle, but it rose to a new high this month and last, with three of the four indicators making new highs this month.
8. Expecting Treasury yields to rise, 9/17/2024, “A 50-basis point cut may be the final ingredient for yields to rise.” I was early to this call as I started to notice economic data rising two months earlier. Still pushing with the theme, the day before the Fed cut 50 basis points in September 2024, I wrote this piece expecting rates to rise after the Fed’s cut because economic data had improved so much by the time of it (not unlike now). Rates started rising from the day before this (9/16/2024) and rose through January of 2025. I later defended this bond-bearish secondary trend call on 10/10/2024, 10/23/2024, 10/29/2024 and 11/1/2024.
It would be natural for bond market yields to rise somewhat to reassess how much Fed cutting is priced in, and for the “soft-landing” theme to take control of the narrative until another terrible economic data report comes along.
9. Expecting Treasury yields to fall, 1/10/2025, “The labor market isn’t stabilizing” Treasury yields (ex. 30yr) peaked two trading days after this was published. Rates fell in this secondary trend through mid-September (tentatively) with a tariff climbdown-related hiccup during April and May. I further supported this bond-bullish secondary trend call on 3/4/2025, 3/20/2024, 4/4/2025, 6/17/2025 (also, on Advisor Perspectives), 6/30/2025, 7/11/2025, and 8/6/2025.
I think that this secondary trend of interest rates upwards since October will peak this month. Its narrative feels like it has saturated its potential, paving the way for hints of weakness to take-over.
10. The true motive for tariffs is revenue, they aren’t going away, and will affect demand as much as inflation, 2/2/2025, “With tariffs, remember demand”, This was written at the outset of tariffs before much was known about them. Most of this has become accepted now.
Trump’s primary motive is to generate revenue and I doubt they will go away quickly. The basic idea is to monetize the US’s size advantage and healthy consumer. While most of the discussion and writing about this topic centers on rising inflation, there should be an equal, if not greater concern for falling demand.
11. Reporting on a dramatic week in the Treasury market, 4/14/2025, “What happened last week?” Markets broke several long-standing correlations in the week of 4/7/2025 – 4/11/2025 and fear was high. I didn’t expect the issue to persist long because it was too damaging to the United States’ image of safety. The Trump administration began de-escalating tariffs from 4/9/2025. The effective tariff rate (Bloomberg Economics) fell from 27.5% on 4/9/2025 to 12.4% by mid-May.
I don’t see the Fed intervening because so far, this is mostly a US credit risk problem, not a broader credit or global problem. For instance, corporate high yield spreads were lower by nine basis points last week and municipal spreads to Treasuries mostly recovered in the latter half of the week. Although I can’t see exactly what will cause this to turn around, I don’t expect this episode to last long because the Treasury market divorcing from its fundamentals can’t be allowed to continue.
12. Moody’s downgrade won’t ultimately matter for bond yields, 5/18/2025, “US downgrade in context and yield effect; probably none.” There was a lot of fear about long-term Treasury yields after Moody’s was the last of the big-three credit rating agencies to downgrade the US from AAA toward the end of a US Treasury sell-off sparked by the tariff climbdown. In this piece, I showed that Japan’s many downgrades in the 2000’s and early 2010’s didn’t affect their bond yields negatively. The 30-year Treasury yield is lower from this point without fiscal issues getting any better because the business cycle looked to be advancing, what yields actually react to. As I said above, the US Credit Default Swap value is around 40bps (not 100), Treasury term premium is unclear; either falling or rising this year depending on which model you use, and the yield curve is as steep as it should be for this part of the business cycle. Despite many wanting fiscal concerns to be evident to prove their dissatisfaction with government policies, they aren’t driving Treasury yields.
The United States still has room on its balance sheet for more debt and as human nature goes, it will probably be used by politicians to avoid taxes—the path of least resistance. If this occurs, the United States will continue being downgraded as the debt to GDP ratio rises, but, from the example of Japan, it doesn’t mean Treasury yields will rise. Despite the furor, the US is a long way from a fiscal crisis.
13. Except for one week, the Dollar isn’t weakening against the 10-year yield unnaturally, 7/2/2025, “The US Dollar is fine”, Just about everyone was certain that the dollar was weakening from a host of Trump policies, but outside of five trading days (what #12 above is about), the dollar is broadly tracking the 10-year Treasury yield before and since.
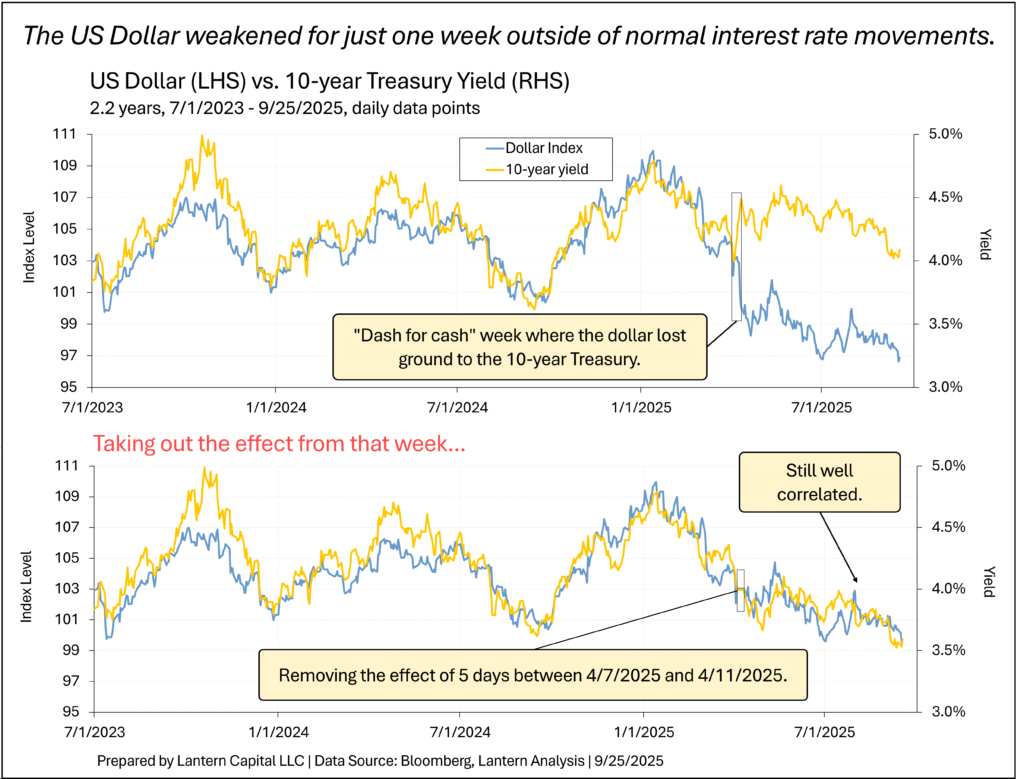
If the difference between the 10-year yield and Dollar is essentially limited to one week based on tariff fear, it is hard to extrapolate that to fiscal fears and Fed independence. Observing how strong the desire is for Treasury yields to rise to force the government to spend less throughout my 25-year career (the mythical bond-market vigilantes), I notice the same sentiment impacting discussion of the Dollar now, yet neither are actually happening.
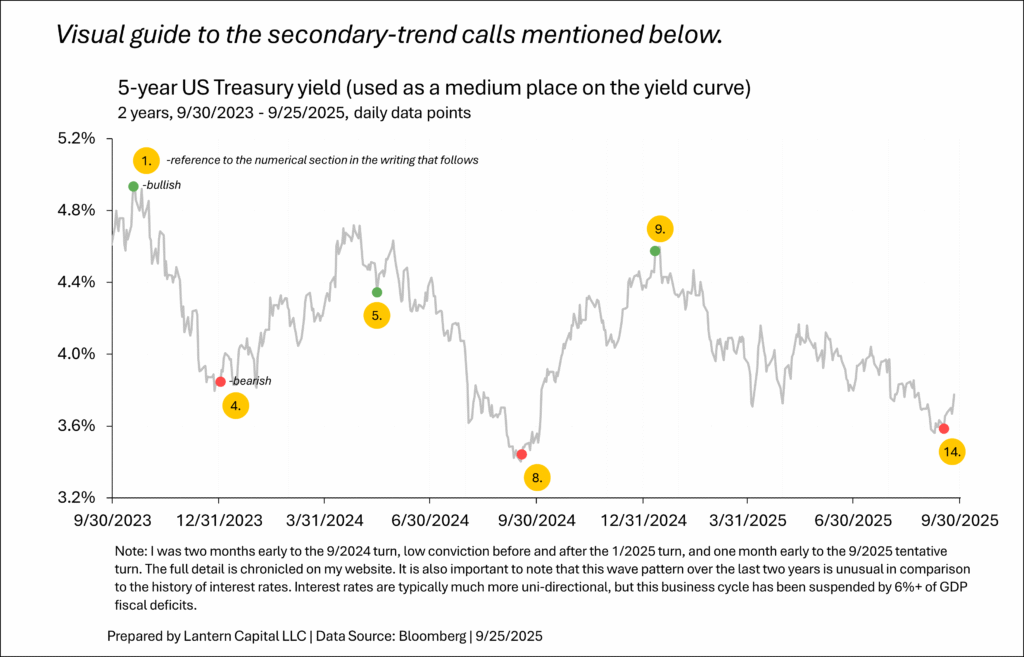
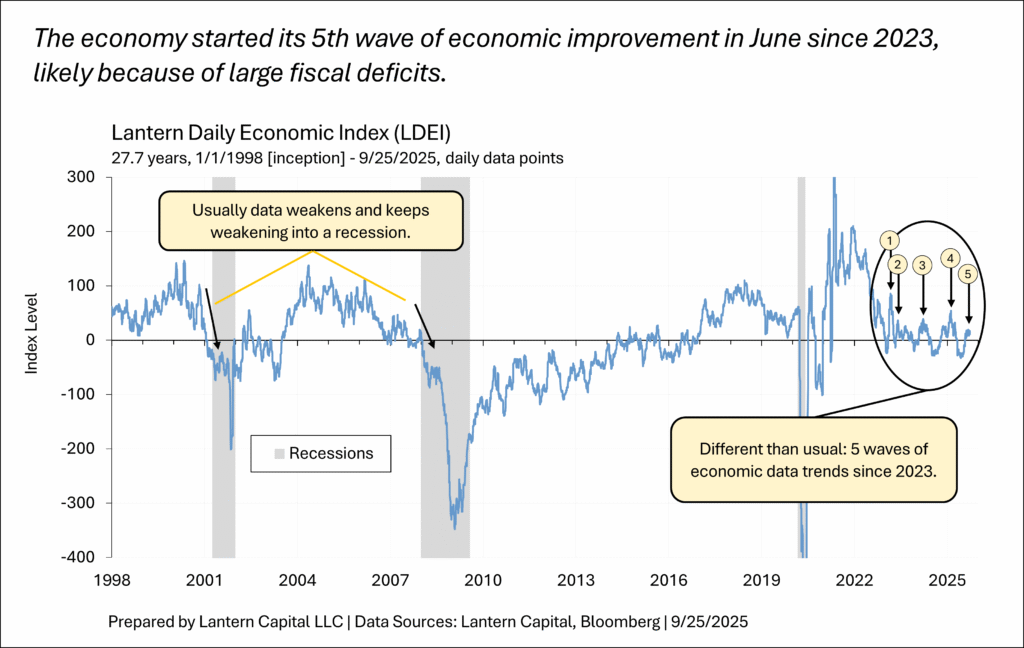
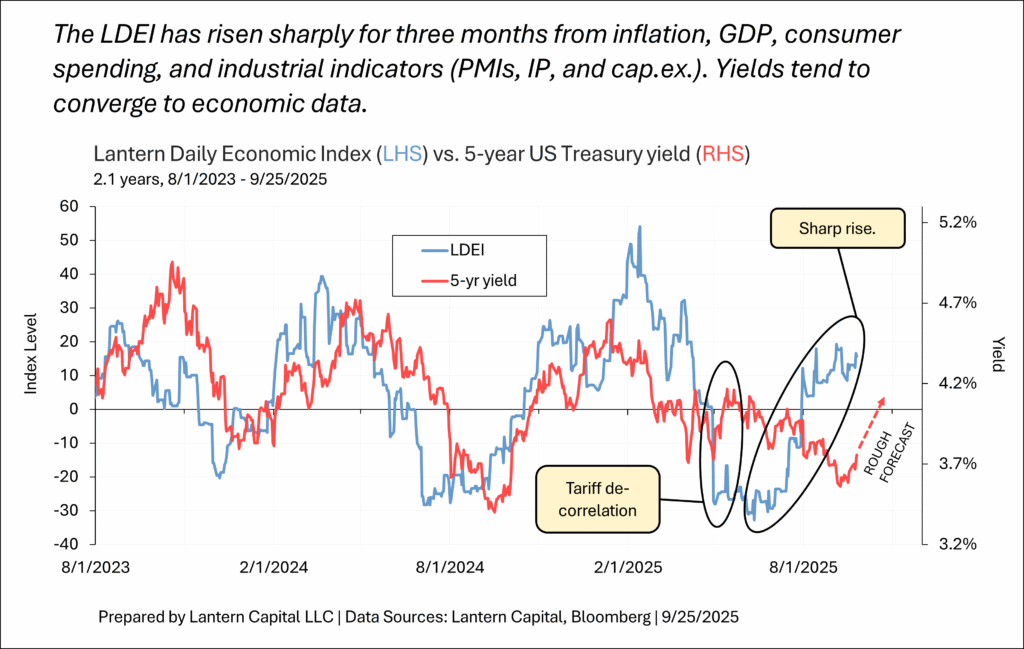
14. Expecting bond yields to rise, 9/16/2025, “Doves Are Ignoring a Lot” I was a month early to this presumed inflection point. I say presumed because more time is needed to know if it was one or not. The market’s sole focus on the labor market in the two months leading up to last week’s FOMC meeting overshadowed that the overall economy was strengthening at the same time as shown through the Lantern Daily Economic Index. I expect interest rates to continue rising to converge with economic data. Treasury yields began to rise on the day of the FOMC meeting, the day after this was published, because the meeting’s SEP projections showed that almost half of the committee was still hawkish. Rising nominal economic data are the reason why so many Fed members are hawkish. This writing also introduced the novel concept that the economy was trapped in a wave pattern of higher and lower economics and Treasury yields because seemingly, easier financial conditions (lower Treasury yields) are all that the economy has needed to recover each time economic data dips over the last two years. Interest rates then rise, constrict the economy, and the cycle repeats.
Zoomed into the last two years and charted with the 5-year Treasury.
From the 9/16/2025 piece which I encourage reading,
To summarize, the Fed Funds rate is at the right level, the labor market looks healthy and maybe set to strengthen, economic data (ex. labor) are strengthening, inflation is also rising broadly for the same reason, both of them probably won’t turn around until Treasury yields rise to constrict the economy, and there is no hint of weakness in corporate markets. While any piece of that puzzle can change quickly, it isn’t the set-up for the Fed to cut back down to 3%, lest telegraph it, just because payrolls are low. The bond market is overpriced and I expect tomorrow’s meeting is when it will start to unravel.
Several of these bond market secondary trend calls were aided by the Lantern Daily Economic Index (free weekly updates) which I invented in the spring of 2024 to fill a gap left from other composite macro indicators available (Citi surprise, CFNAI, and GDPnow) and nail down what I used to track loosely in my head. It is the only index in the world measuring daily nominal economic growth continuously and intends to reflect the concept of the “totality of the data” that the Fed has coined. It is available on the Bloomberg Terminal at LTRNLDEI <Index>. The index has been a revelation since it was created, allowing a clear view of how new economic data change the overall economic picture each day and it helps to determine if Treasury yields are moving from changes in economic data or something else. It allows for the study of subsets of indicators within the index which has led to recent insights that inflation is moving with real variables of the economy, labor market data is moving in opposition to the rest of the economy, or that the labor market is still significantly stronger than where prior recessions have begun, all written about in the article referenced in #14 above.
No writing like this is complete without explaining what I’ve been wrong about. The first thing to note is that reading through my historical posts is messy (nothing has ever been removed) and I’ve gotten many little things wrong (and right). But I take pride in getting the big things right as highlighted in this piece. I estimate that using the six secondary trend calls (conservatively starting from their first mention) would’ve picked up an average of 241 basis points of yield change versus just 91 basis points from what Treasury yields have fallen in the same period (average of 2,5,10,30). Ask if you want to see this study.
As indicated in the notes to the chart at the start, I was early to two of the bond market secondary trend inflection points (#14 above was one of them), I waffled over the top of the January 2025 inflection point and didn’t expect rates to rise so much from the tariff climbdown in April and May of 2025. I also thought a recession was about to begin each time economic data fell precipitously but then delayed the call when economic data began to rise again. I take solace in the fact that, recession or no recession, I called the interest rate direction correctly and like to remind which side of the business cycle the economy is on; the slowing/receding side since 10/2023. I still think a recession is ahead but want to see the LDEI fall without interest rates rising first to know the stimulus-suspended cycle identified in #14 above has been broken. I also thought that mid-February 2025 was the cyclical peak of the stock market, but it has risen to new highs.
All that said, I haven’t noticed anyone else in the industry making bond-market calls this accurately. Keep watching Lantern to know what interest rates are doing.