3-yr rate call performance
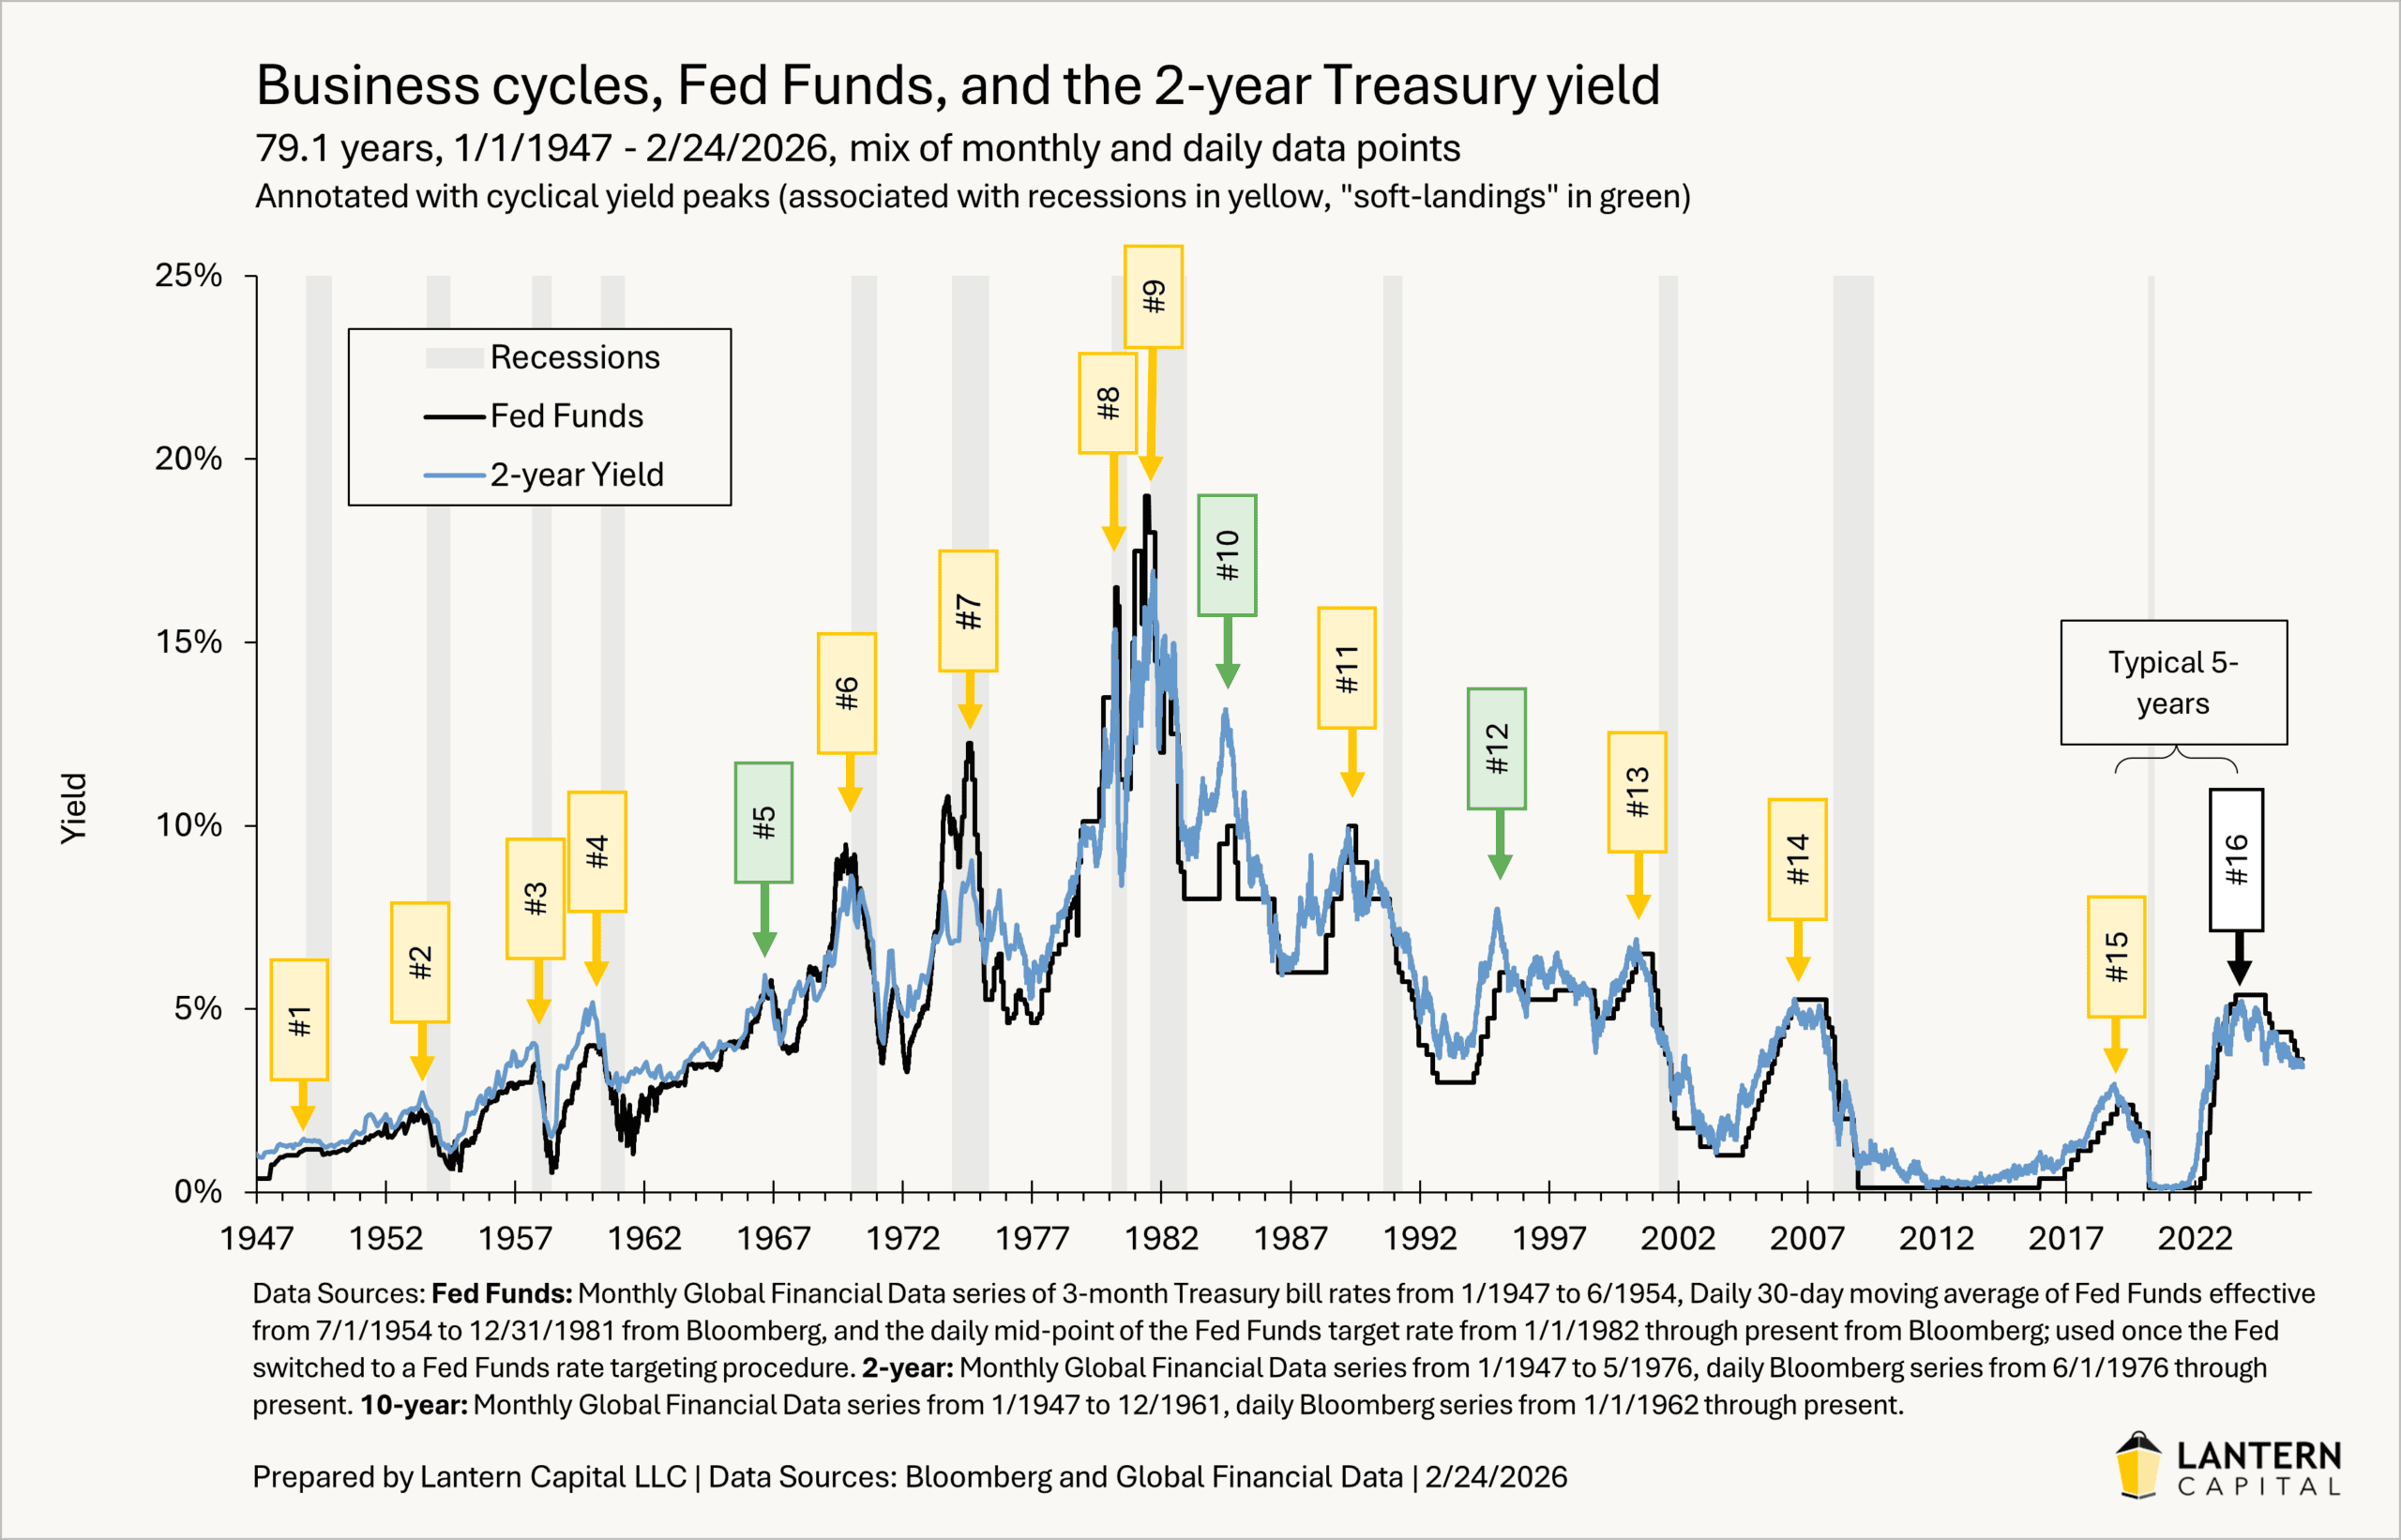
This writing presents the value of my interest rate calls back to November of 2022 (3.2 years ago) where I first advocated owning US Treasury duration in anticipation of rates falling in the ongoing, but slowly evolving, downside of this business cycle (note: I define business cycles by primary trends in the 2-year Treasury yield to include soft landing periods and the economic negativity before, during, and after recessions (chart). The calls have captured a majority of each of the secondary trends in interest rates since their cyclical peak in October of 2023 and show significant outperformance to passive benchmarks.
Active management calls
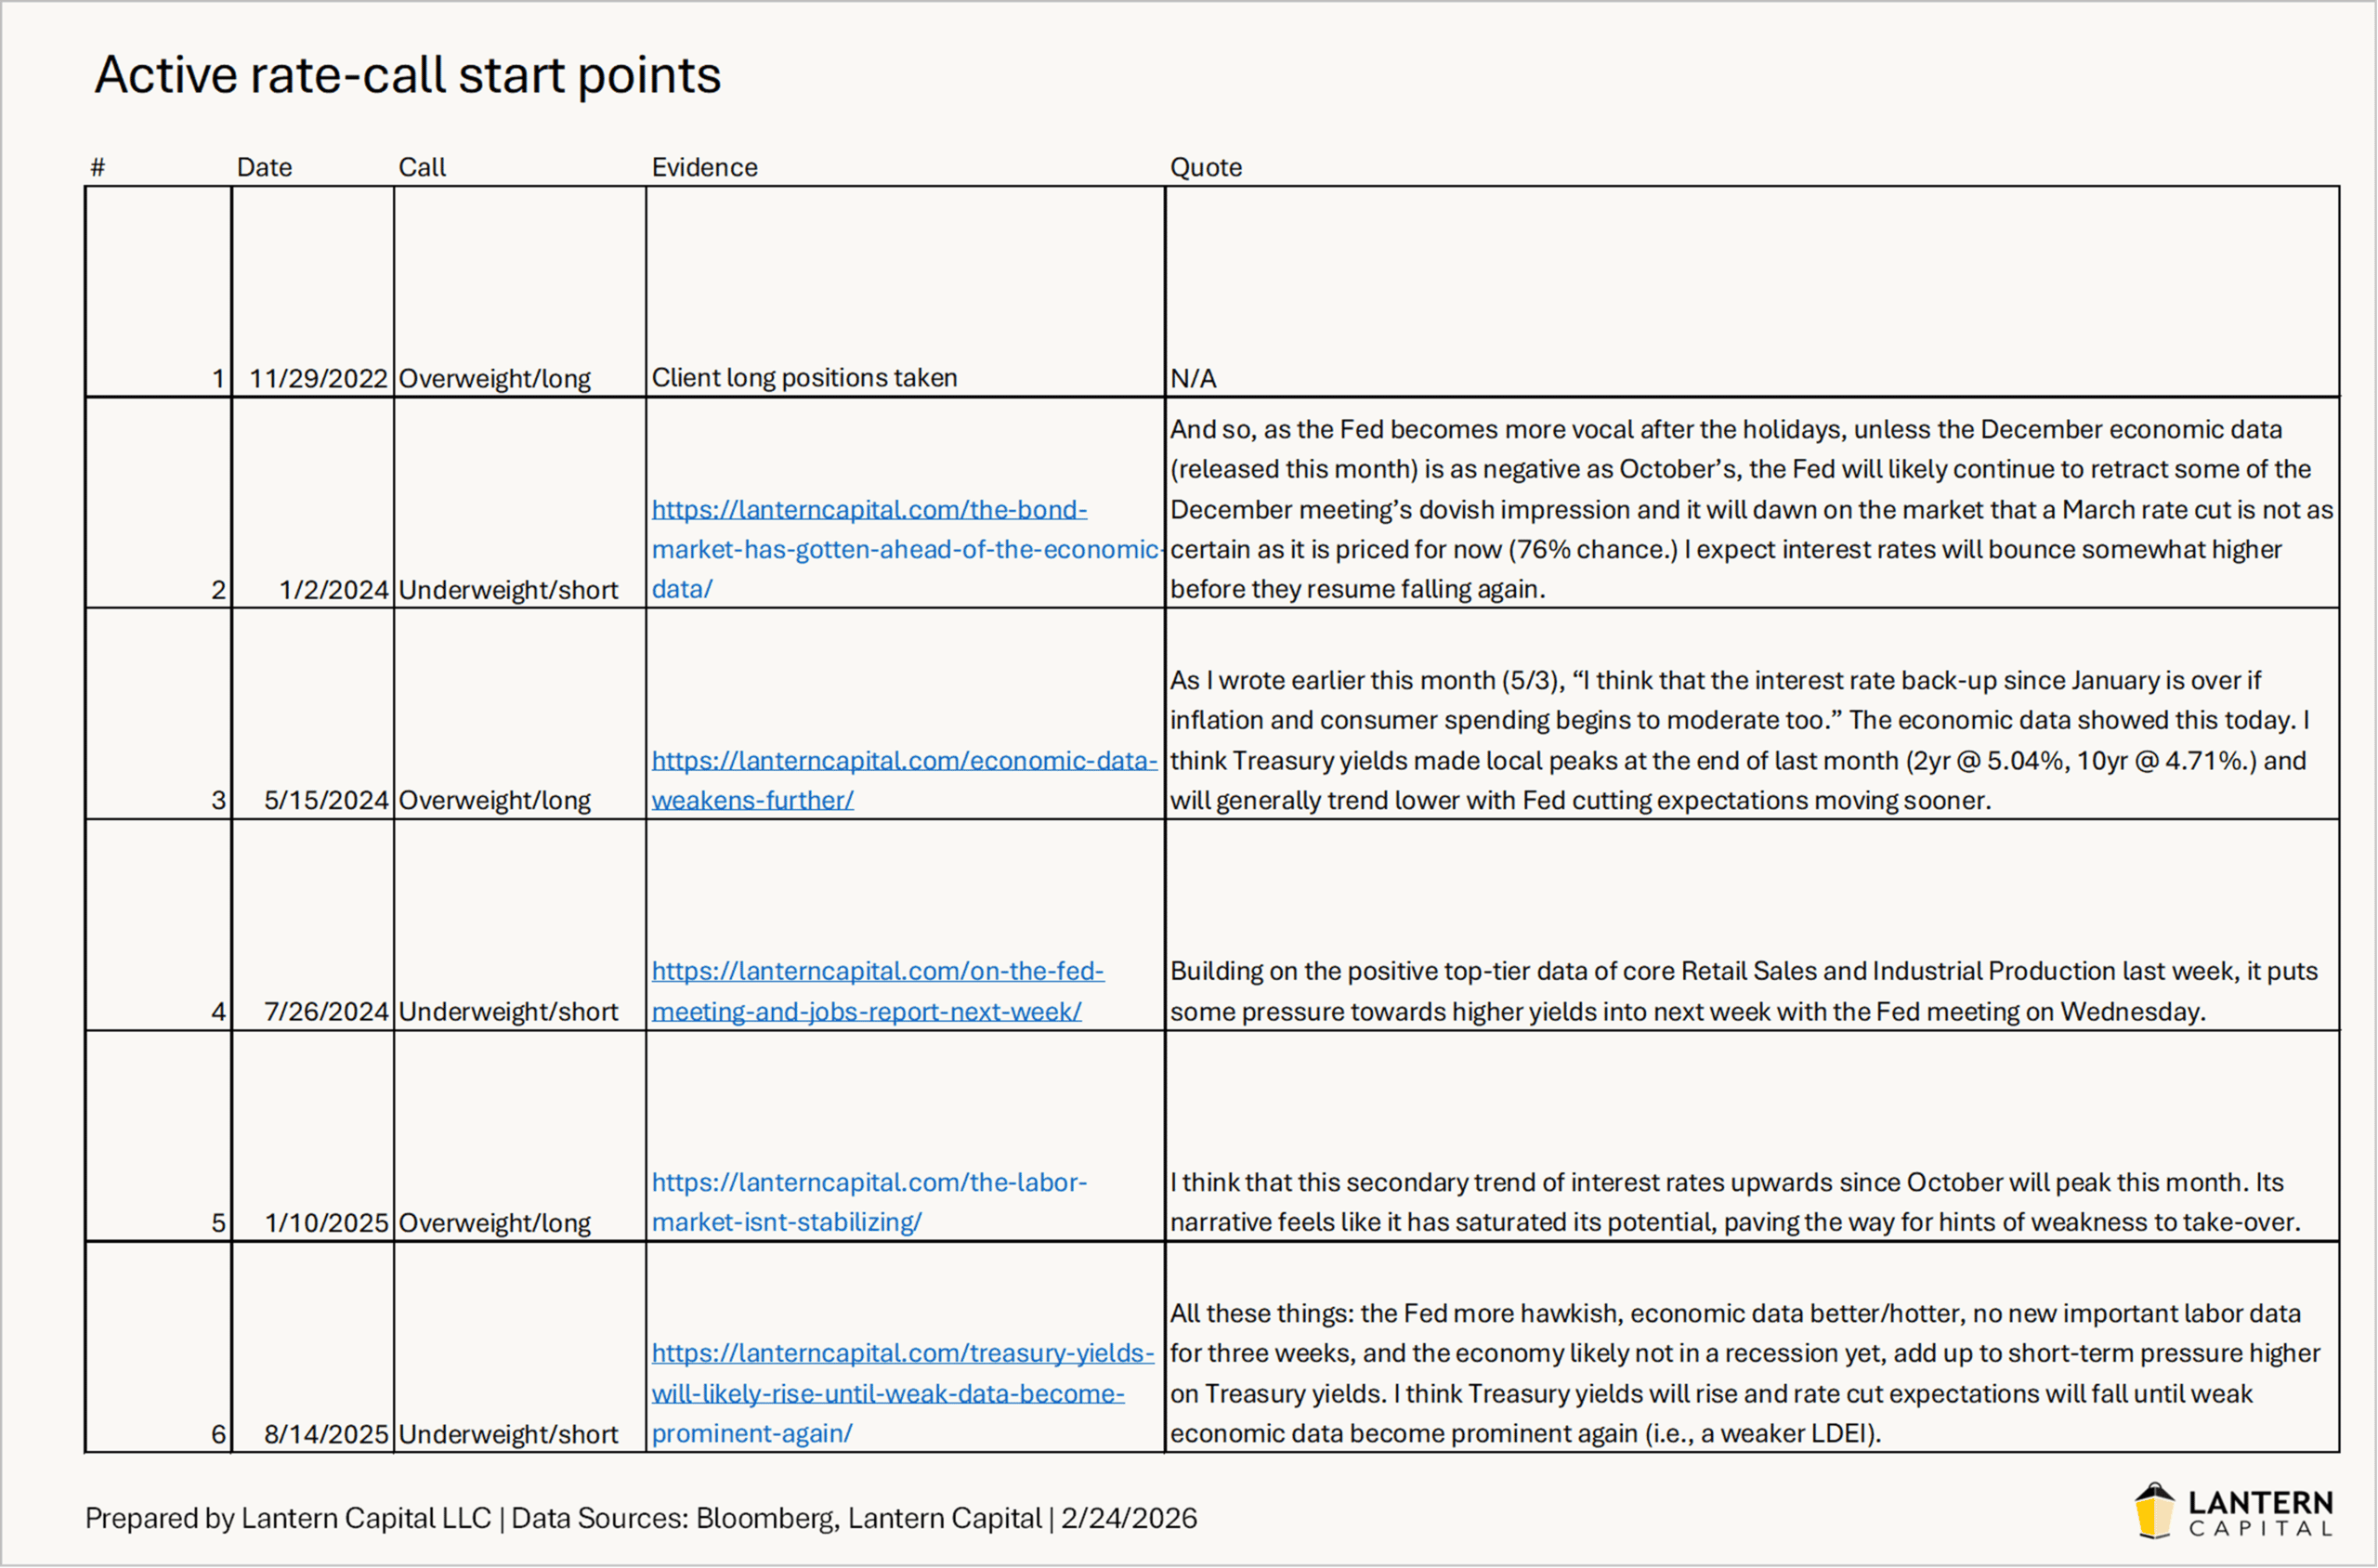
Both model portfolios below use my publicly available calls from posts on my website, and before that, client positions first taken on 11/29/2022 after a period of advocating cash while the Fed raised rates. My calls are simple (rates up or down), few (just six over three years), alternating, verifiable, and defended in between. For these model portfolios, I apply the calls from the most conservative (unflattering) or obvious point of their mention (list here). While the calls add significant value, they are far from perfect. I am sometimes early to trends, I often expect more yield movement from each trend, the reasoning for the calls sometimes shifts while they occur, and they vary in conviction. Nevertheless, the calls and their defenses are documented in public posts on my website and are further defended against counter-arguments that arise in daily non-public commentary sent to clients and colleagues.
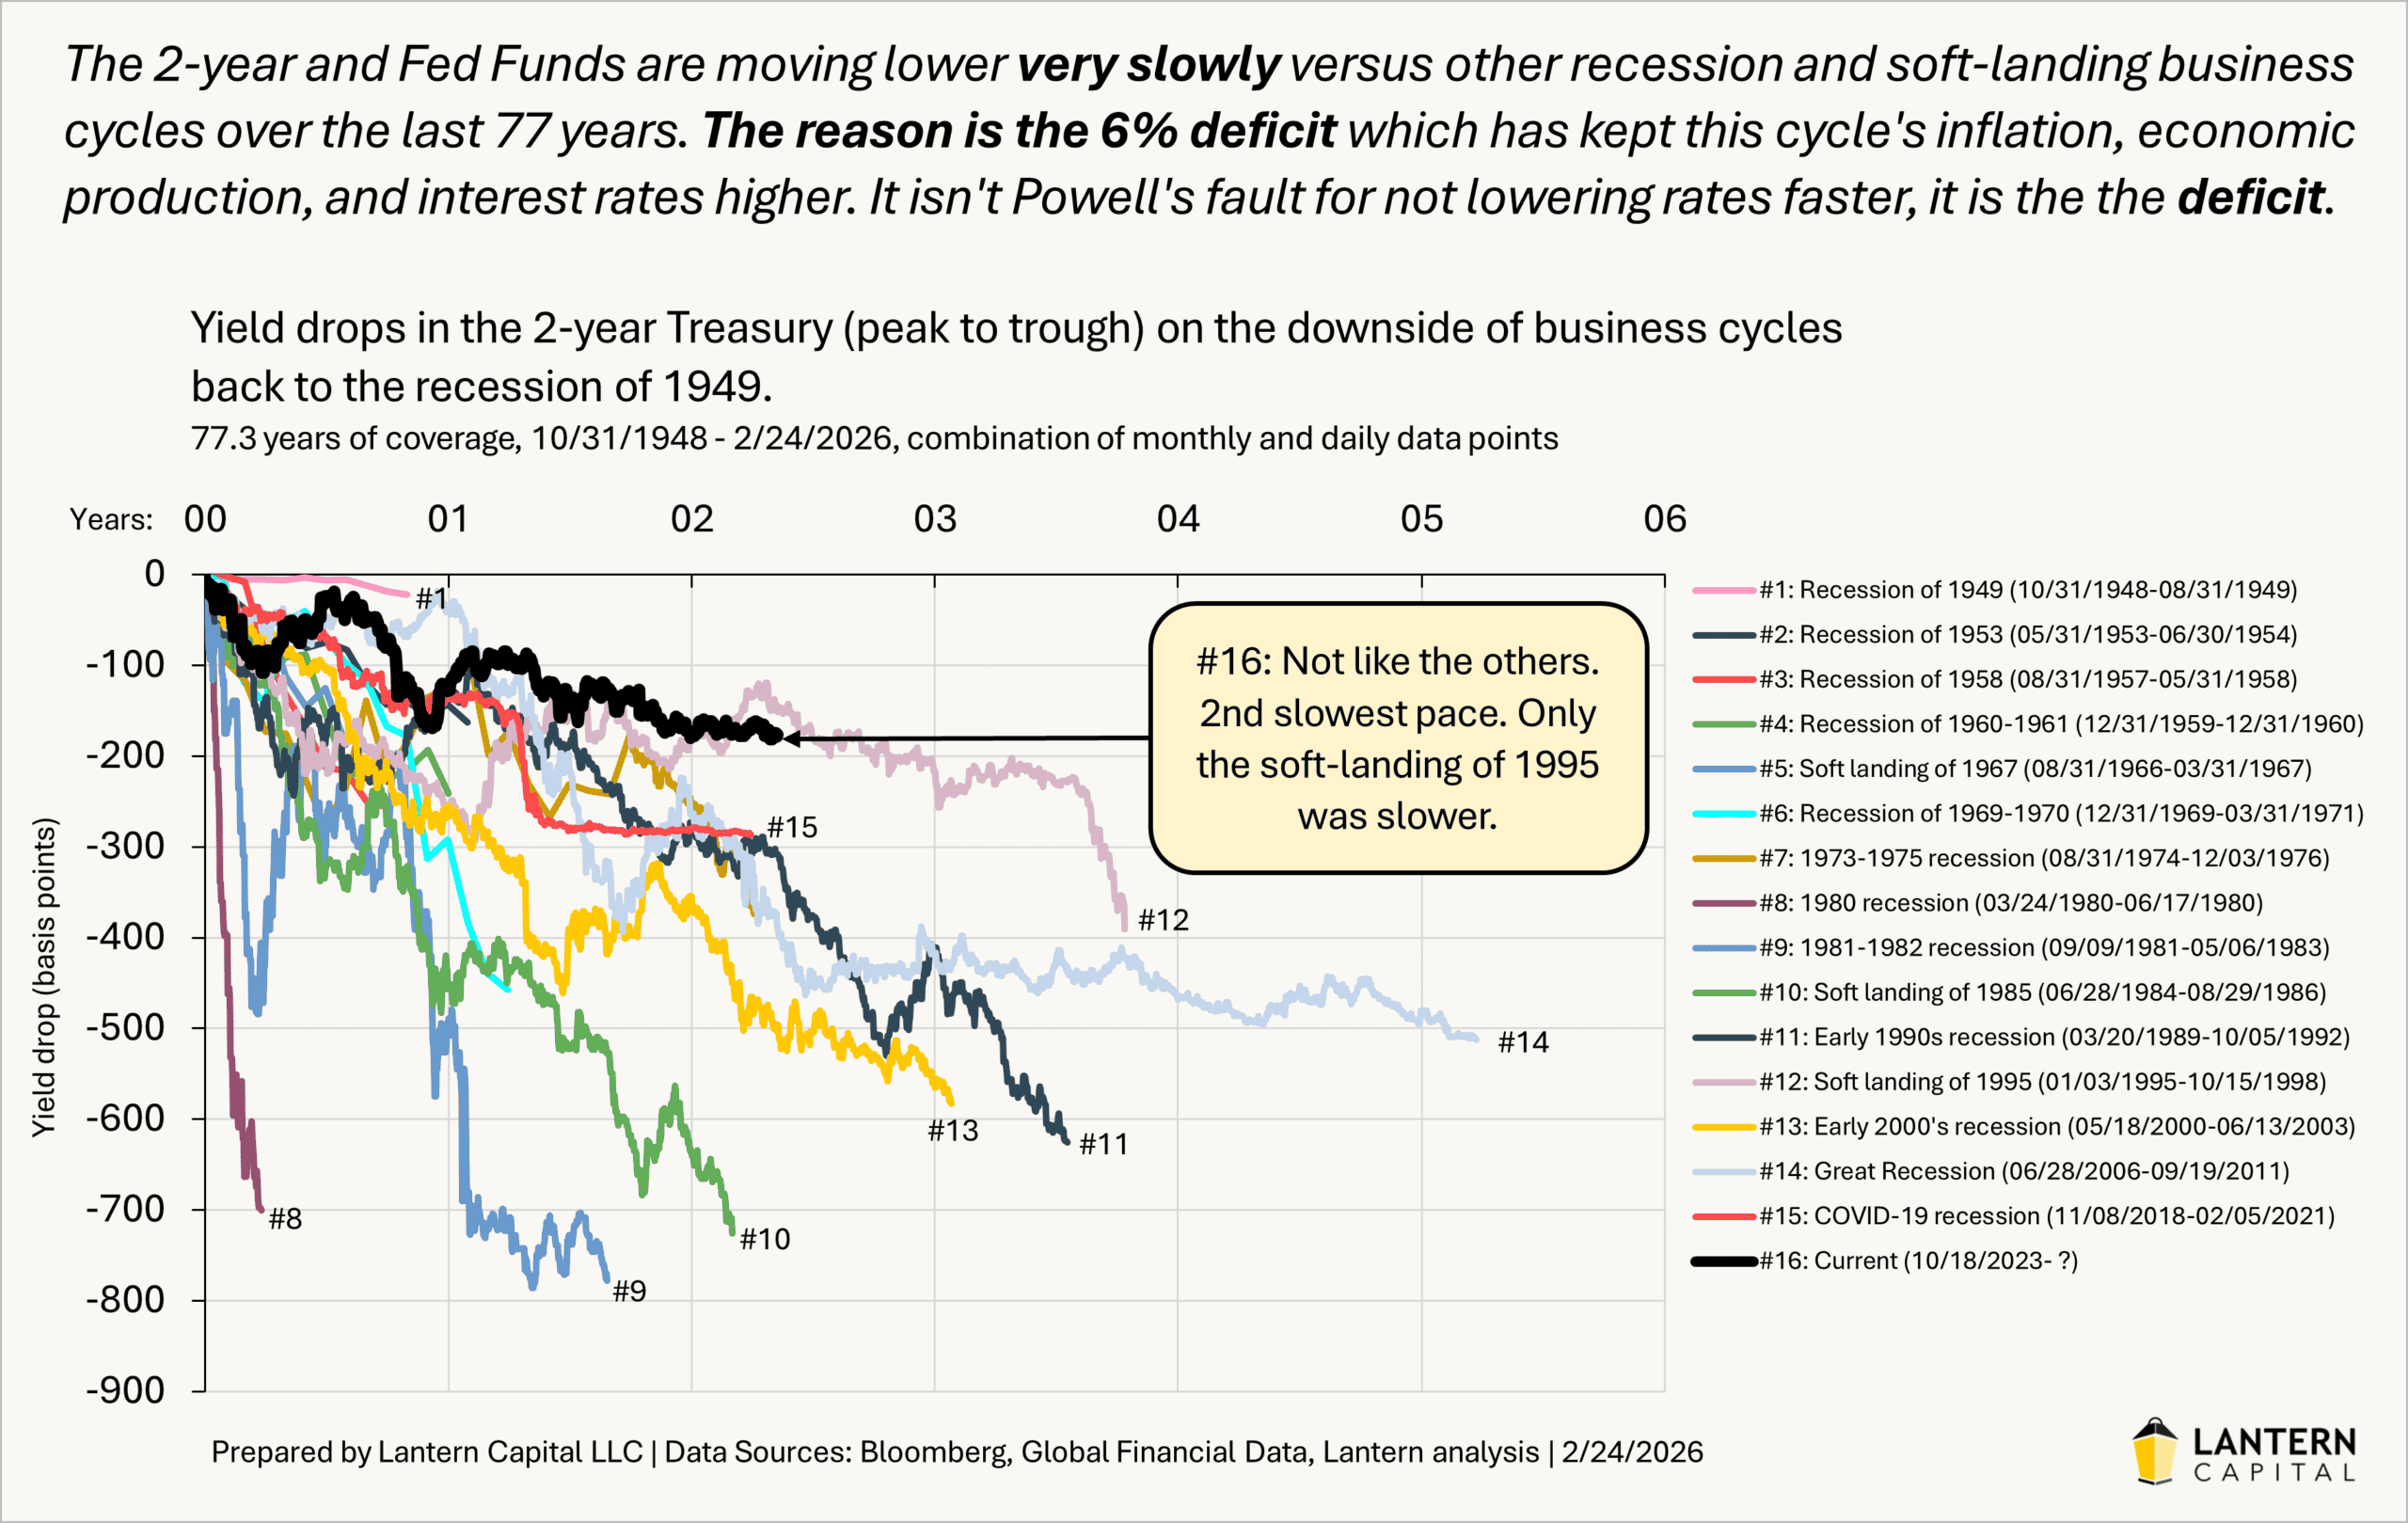
My mission with them is to identify which side of the business cycle the economy is on first, and then to further identify secondary trends (counter-trends) of interest rates within that primary trend which tend to last 3-9 months. The calls are intended to be continuous, lasting until a call for the opposite direction is made. All of this is to keep active management simple, transparent, accountable, and slow moving; the place where I think directional calls are helpful. For orientation, I think the economy is on the downside of the business cycle since 10/2023 and about a third of the way through it (related to rate fall, not time) based on the steepness of the yield curve. In this downside of the business cycle, there have been enormous secondary trends and a slowly falling 2-year/Fed because the 6% pro-cyclical deficit has slowed the process down. This has been the second slowest downside of the business cycle on record back to 1948 (chart).
Recent call
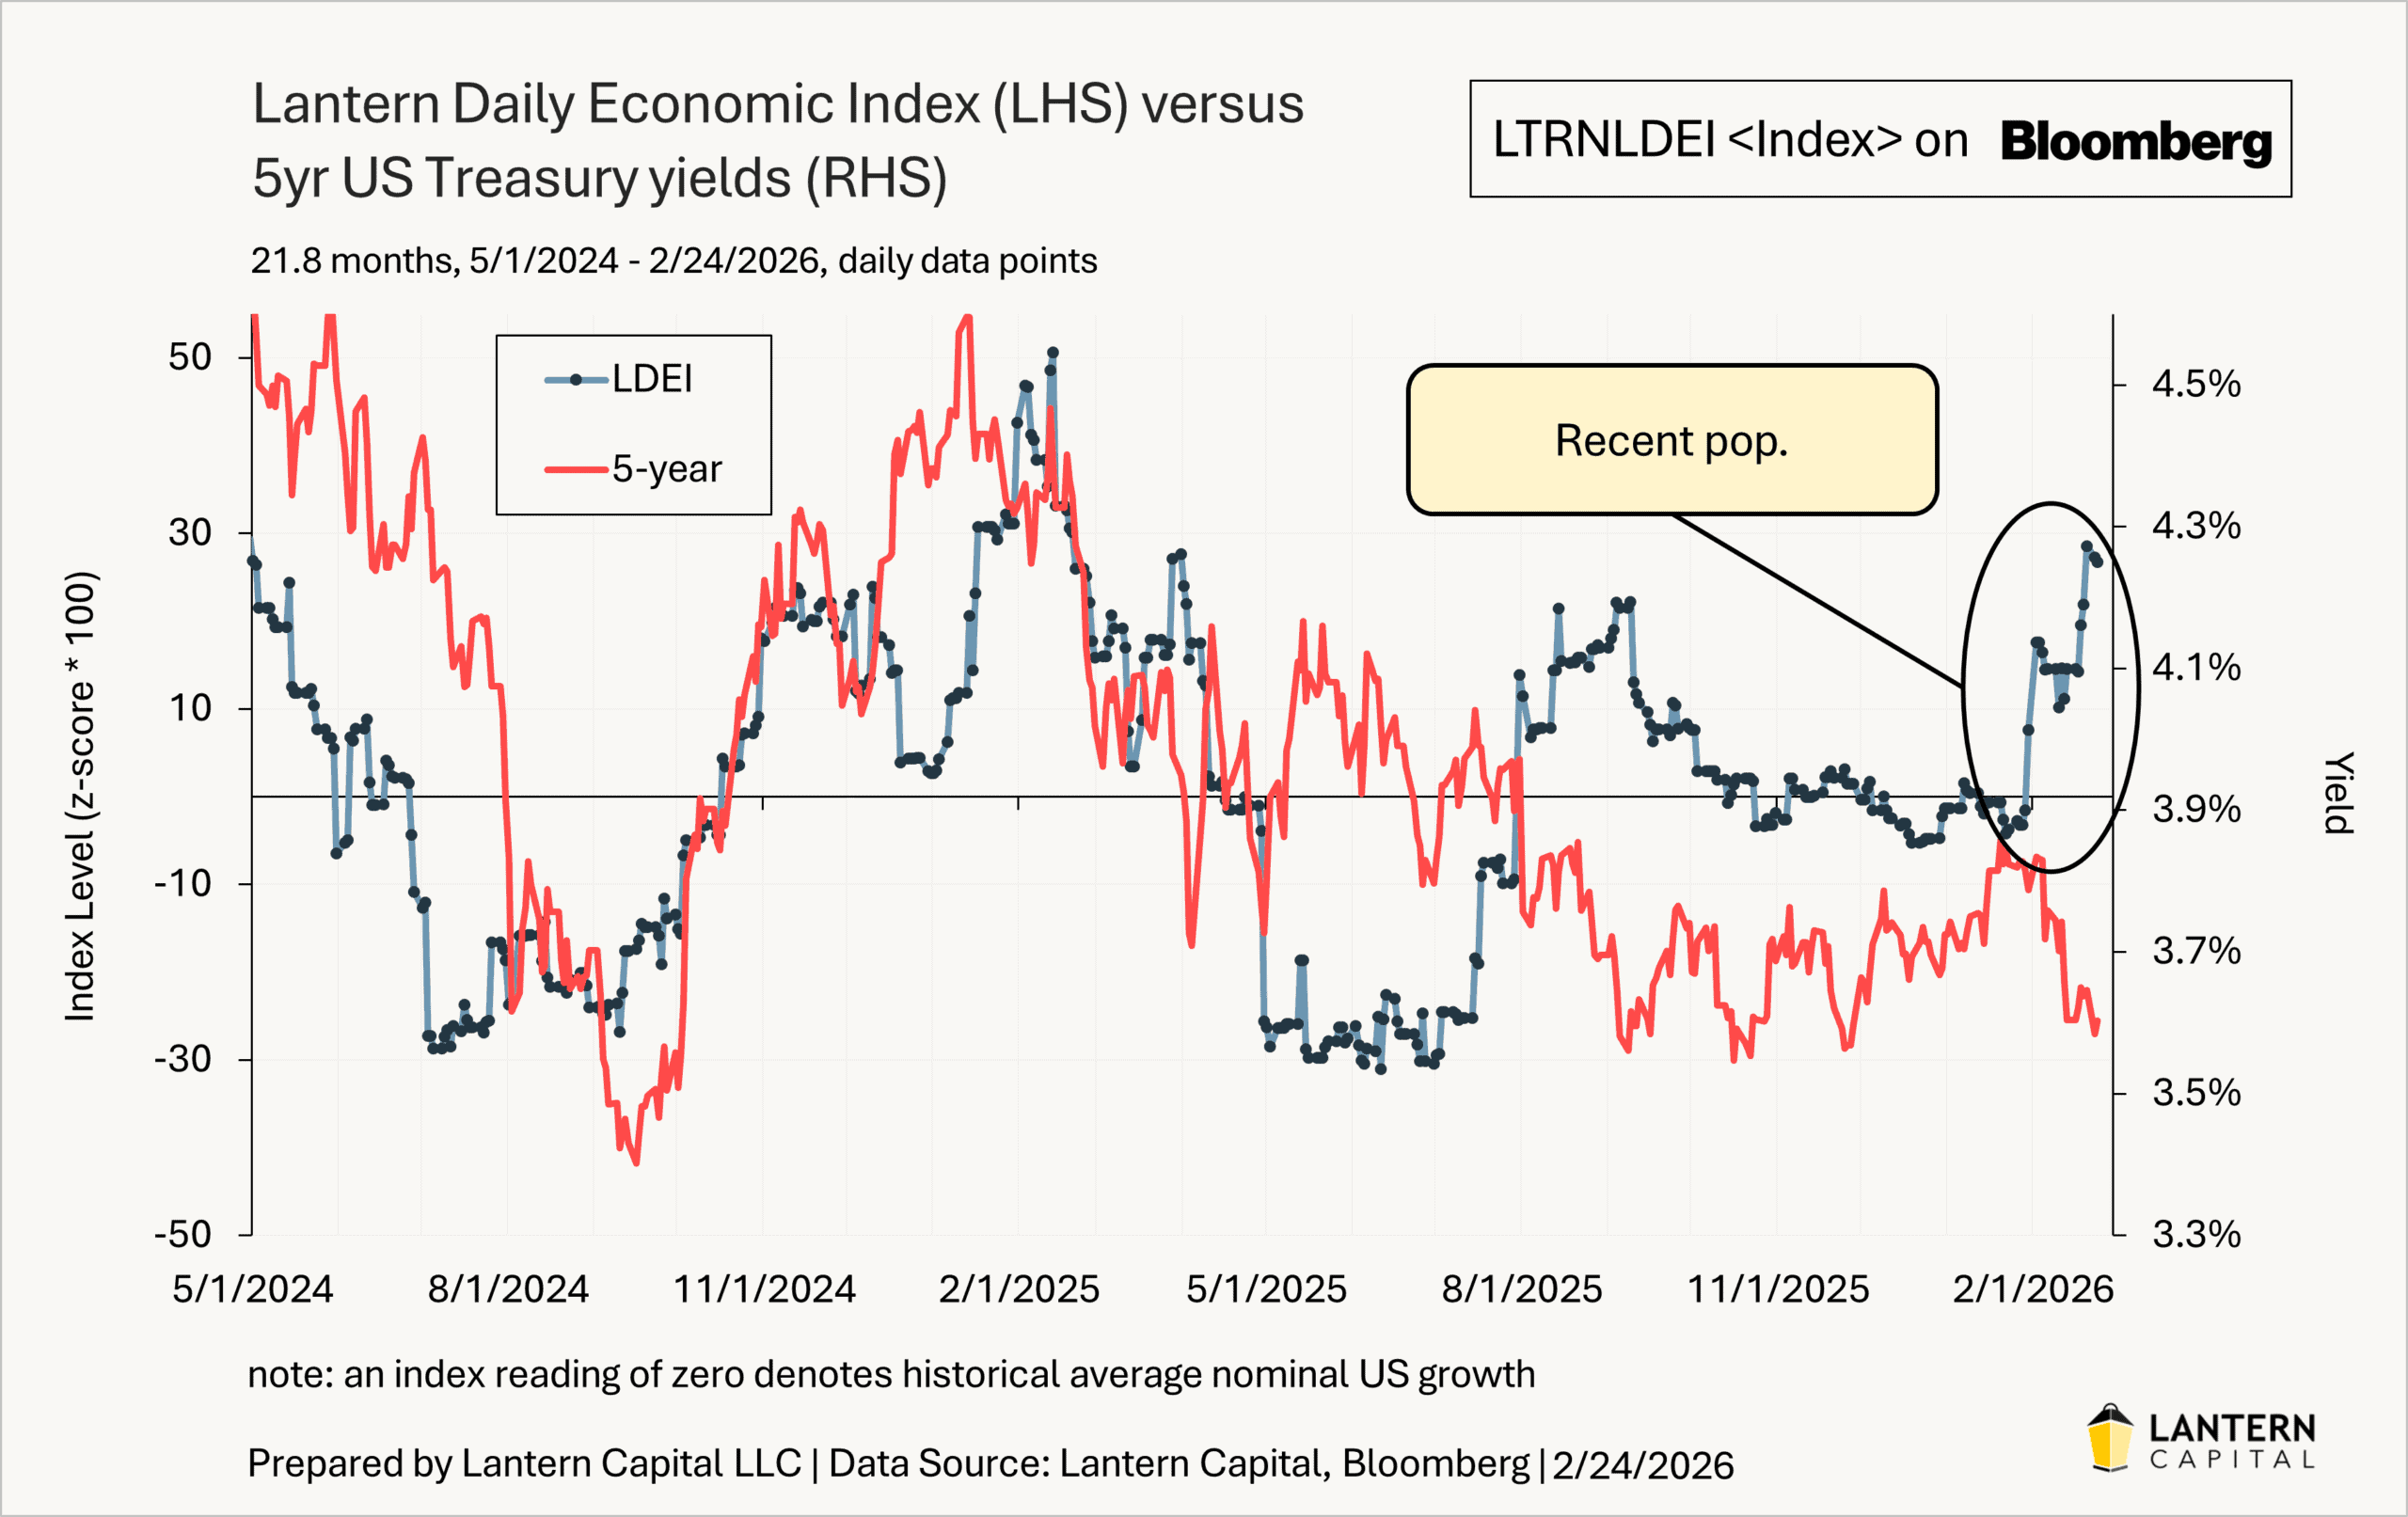
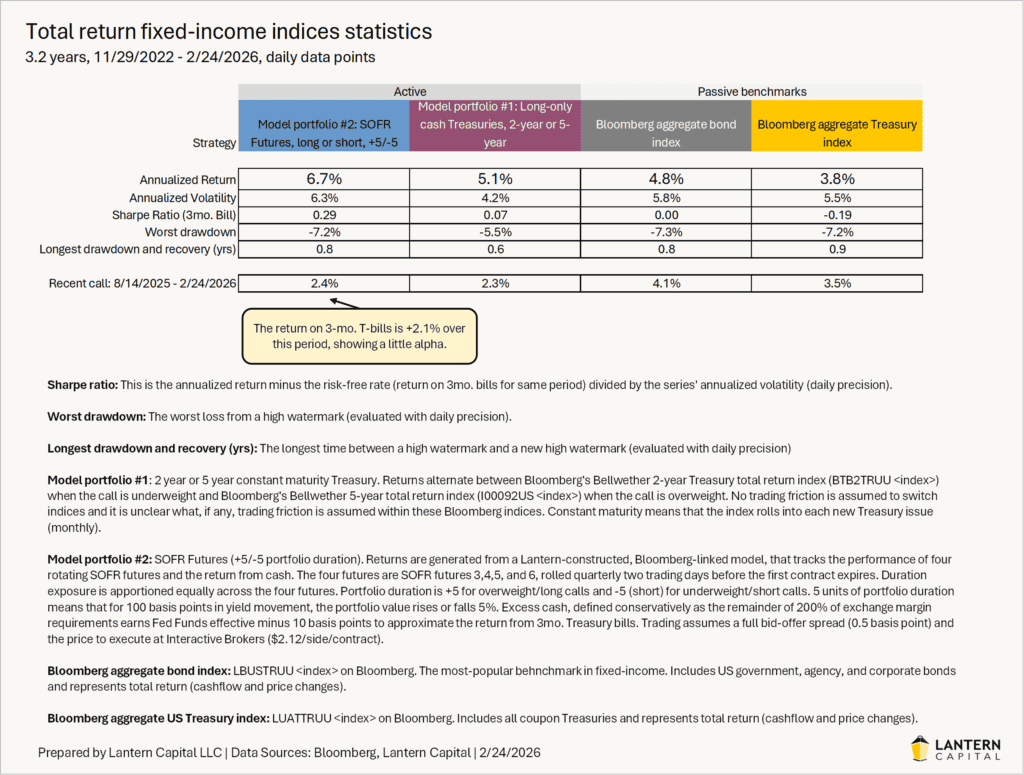
Even though Treasury yields are somewhat lower since my call for them to rise starting six months ago on 8/14/2025, yield curve dynamics (negative carry and yield curve roll-up) have more than cancelled out the rate fall, returning a small amount of alpha. While not correct on yields so far, this call has been correct about the economy. Job creation last year was low from low population growth and the 6% deficit keeps rescuing the economy from each recession scare; what I expected late last year. I don’t foresee the call changing soon because I continue to think the economy, inflation, and labor market will get hotter from easy financial conditions (low rates), the 6% deficit/GDP, and a strong fiscal impulse in the first quarter from the enactment of parts of the “One Big Beautiful Bill Act.” Evidence of this is already here with manufacturing ISM, PPI, CPI, industrial production, wages, and a fall in the unemployment rate contributing to the Lantern Daily Economic Index (LDEI) popping higher in recent weeks (chart below). Returns since this call began are isolated in the returns table at the end of this piece.
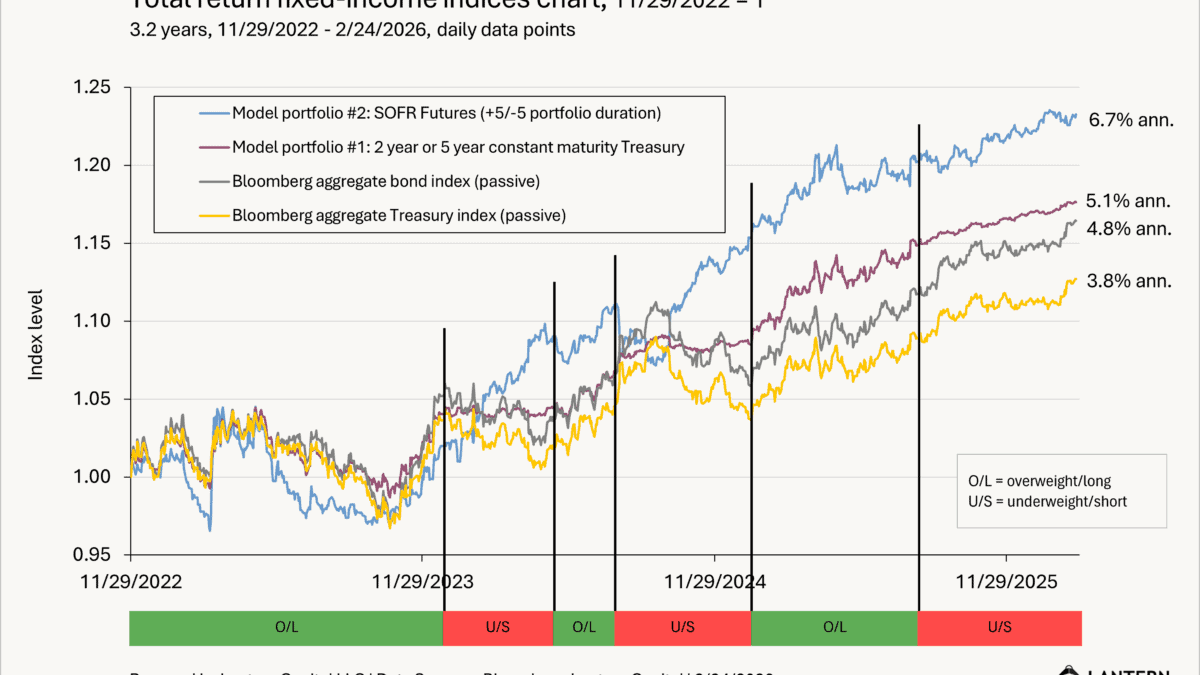
Model portfolio #1: simple example (relative return)
The first example uses long-only cash Treasuries (i.e., not futures) with no leverage. I show this as a readily accessible low complexity example. For this model portfolio, when I’ve been bullish on rates, expecting rates to fall, performance from Bloomberg’s constant maturing five-year Treasury total return index is applied. When I am bearish on rates, expecting them to rise, Bloomberg’s constant maturity 2-year total return index is applied which has less duration (interest rate sensitivity). The 2-year and 5-year have been chosen to produce return volatility comparable to Bloomberg’s aggregate bond index. This return stream results in +1.4% annualized more than Bloomberg’s aggregate Treasury index and +0.4% annualized more than the Bloomberg aggregate bond index (which has credit risk in it), with only three-quarters the volatility, worst drawdown, and longest drawdown length. This model’s last high watermark was made on 2/17/2026 and is down just -0.1% below it (current drawdown). The model is gross of any management fees.
Model portfolio #2: full-monty example (absolute return)
The second return stream (blue line) is what I would call the “full-monty” of what I’ve developed. This is a return stream of a strip of four SOFR futures in the 0-2 year sector rolled each quarter to maintain exposure and yield curve position, going long five units of portfolio duration (+5) when I am bullish on rates and going short five units of portfolio duration (-5) when I am bearish on rates. SOFR futures represent a purer play on Fed funds expectations than Treasuries do because they have no term premium, and like Treasuries, have no credit risk because they represent Treasury collateralized rates unlike the old Eurodollar futures. This return stream has more risk than the “simple example” above because it goes long and short, but has a 2.9% annualized higher return than the Bloomberg aggregate Treasury index and a 1.9% annualized higher return than the Bloomberg aggregate bond index with similar volatility, worst drawdown, and longest drawdown length statistics. It should be noted that because this example uses interest rate futures, market exposure is scalable. The duration target could be lowered from +/-5 nearer to money market exposure of say +/-0.5, or could be raised up to stock market-like volatility of +/-20 and beyond. The +/-5 duration target in this example was chosen to have similar volatility to the Bloomberg Aggregate Bond Index. This model’s last high watermark was made on 1/22/2026 and is down just -0.2% from that point about a month ago. The model is gross of any management fees.

This three-year historical analysis shows that my interest rate calls have added significant value over time and are profitable in periods of falling and rising yields. Performance from either model portfolio is positive in each of the six call periods.
HYPOTHETICAL PERFORMANCE RESULTS HAVE MANY INHERENT LIMITATIONS, SOME OF WHICH ARE DESCRIBED BELOW. NO REPRESENTATION IS BEING MADE THAT ANY ACCOUNT WILL OR IS LIKELY TO ACHIEVE PROFITS OR LOSSES SIMILAR TO THOSE SHOWN. IN FACT, THERE ARE FREQUENTLY SHARP DIFFERENCES BETWEEN HYPOTHETICAL PERFORMANCE RESULTS AND THE ACTUAL RESULTS SUBSEQUENTLY ACHIEVED BY ANY PARTICULAR TRADING PROGRAM.
ONE OF THE LIMITATIONS OF HYPOTHETICAL PERFORMANCE RESULTS IS THAT THEY ARE GENERALLY PREPARED WITH THE BENEFIT OF HINDSIGHT. IN ADDITION, HYPOTHETICAL TRADING DOES NOT INVOLVE FINANCIAL RISK, AND NO HYPOTHETICAL TRADING RECORD CAN COMPLETELY ACCOUNT FOR THE IMPACT OF FINANCIAL RISK IN ACTUAL TRADING. FOR EXAMPLE, THE ABILITY TO WITHSTAND LOSSES OR TO ADHERE TO A PARTICULAR TRADING PROGRAM IN SPITE OF TRADING LOSSES ARE MATERIAL POINTS WHICH CAN ALSO ADVERSELY AFFECT ACTUAL TRADING RESULTS. THERE ARE NUMEROUS OTHER FACTORS RELATED TO THE MARKETS IN GENERAL OR TO THE IMPLEMENTATION OF ANY SPECIFIC TRADING PROGRAM WHICH CANNOT BE FULLY ACCOUNTED FOR IN THE PREPARATION OF HYPOTHETICAL PERFORMANCE RESULTS AND ALL OF WHICH CAN ADVERSELY AFFECT ACTUAL TRADING RESULTS.