Lantern Daily Economic Index (LDEI)
LTRNLDEI <Index> on the Bloomberg Terminal and weekly updates below.
Sections below:
1. Summary
2. Purposes
3. Correlations
4. Technical details and development
5. Indicators and transforms
6. Daily charts report example
7. Description
8. Weekly updates
1. Summary
A first-of-its-kind index measuring nominal US economic growth daily.
• Created in 2024 by seasoned index-builder Eric Hickman
• Patterned after the methodology of the Chicago Fed National Activity Index
• Daily and measures growth
• A better surprise index
• Provides the most meaningful and timely read on U.S. economic performance
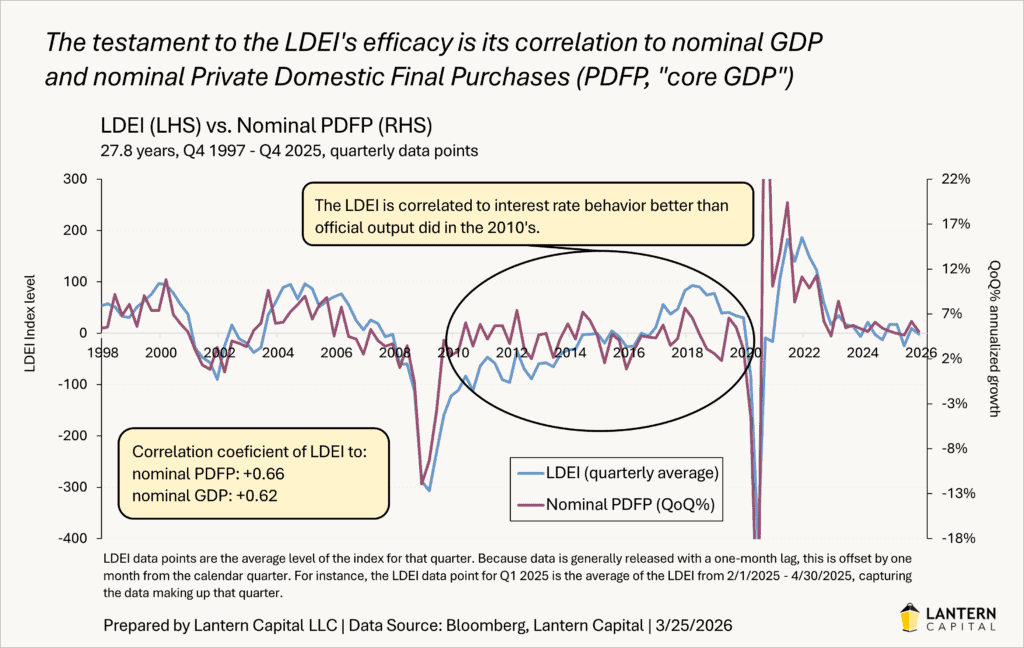
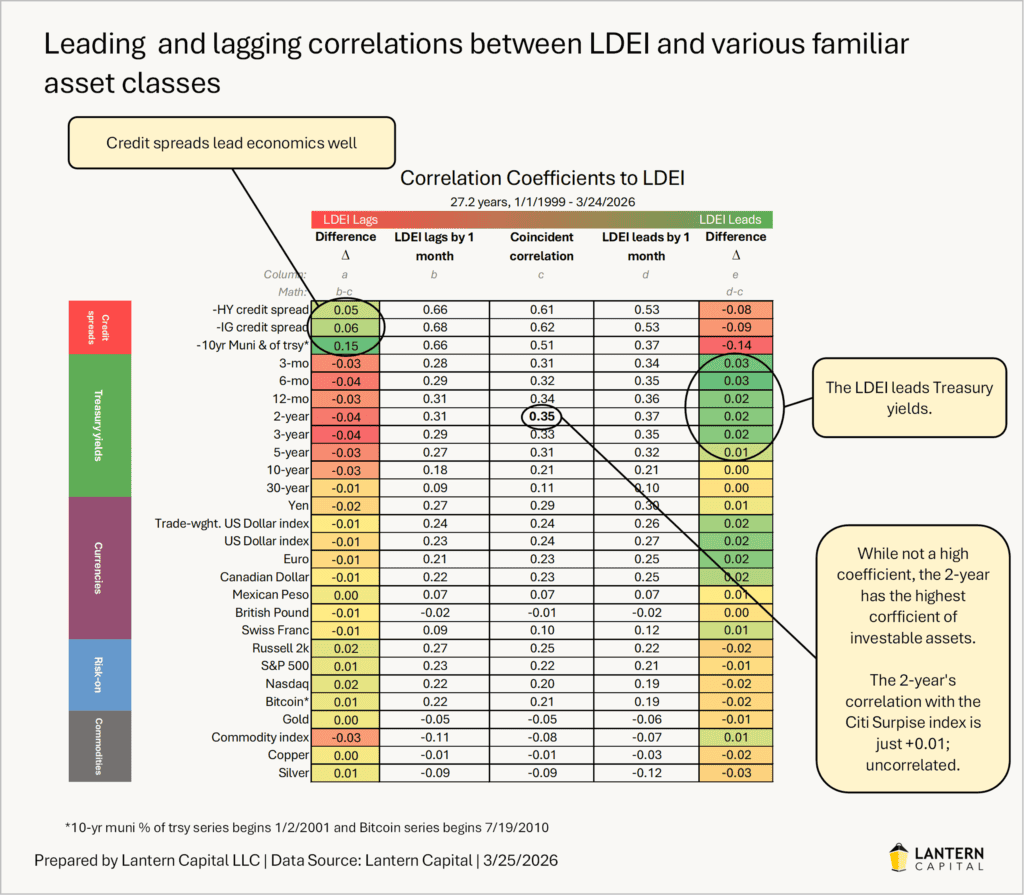
• Correlates to U.S. Treasury yields and nominal GDP with a lead
• Measures growth of all economic data segments; inflation, real, and soft
• Only high-quality, time-tested indicators
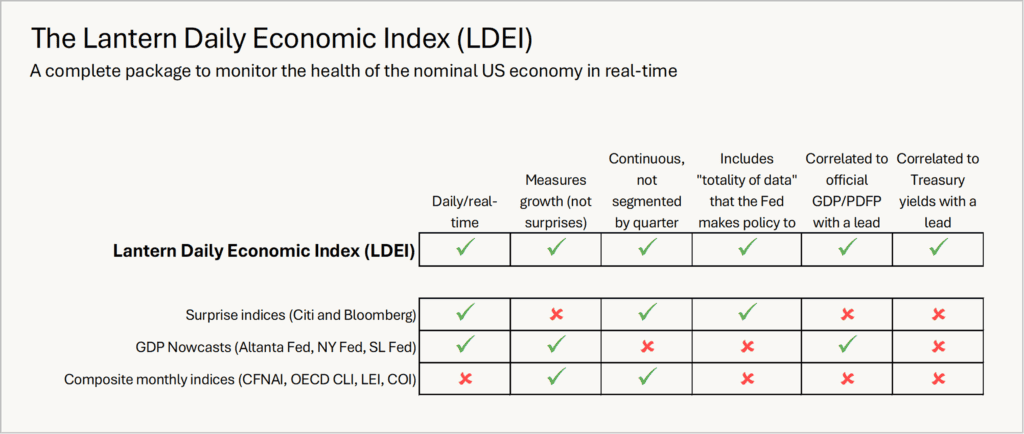
The Lantern Daily Economic Index (LDEI) is a daily measure of U.S. nominal economic growth that tracks 45 widely-followed indicators across eight categories: labor, business, consumer spending, inflation, housing, income, GDP, and consumer confidence. What sets it apart is that data is applied to the index on the day it is released, rather than being combined for it’s relevant observation period (similar to surprise indices) and it measures growth in indices vs. differences between releases and economist estimates (i.e., surprise indices). Full description below.
2. Purposes
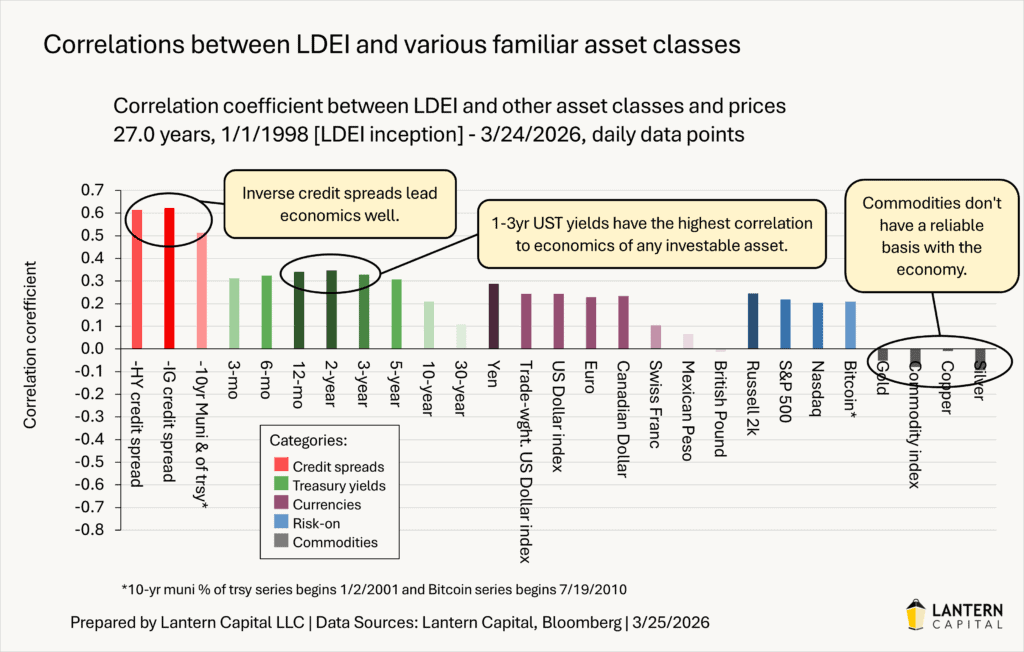
1. To isolate the economic component of Treasury yields and help identify what other factors may be influencing them.
2. To serve as a reliable “throughline” of economic data in totality — stepping back from individual data points to see the bigger picture, as Fed officials like Goolsbee and Powell (throughline), or Dudley and Daly (impressionist painting) have described.
3. To give anyone interested a single, objective daily read on the strength of the nominal economy and its categories — no economist required to interpret the data. Lantern’s secondary firm mission (being right is the first) is to demystify the economy and make it more accessible for anyone.
3. Correlations
4. Technical details and development
5-page document explaining the index:

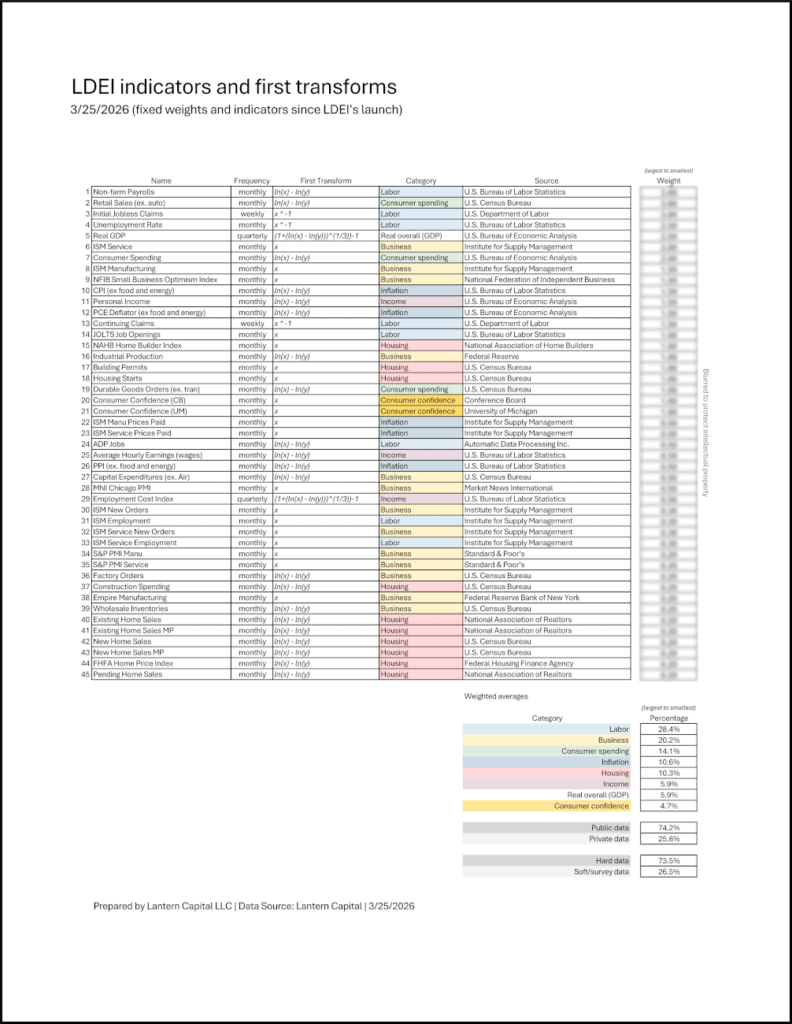
5. Indicators and transforms
Indicators and weights have been fixed since the index’s launch. [PDF]
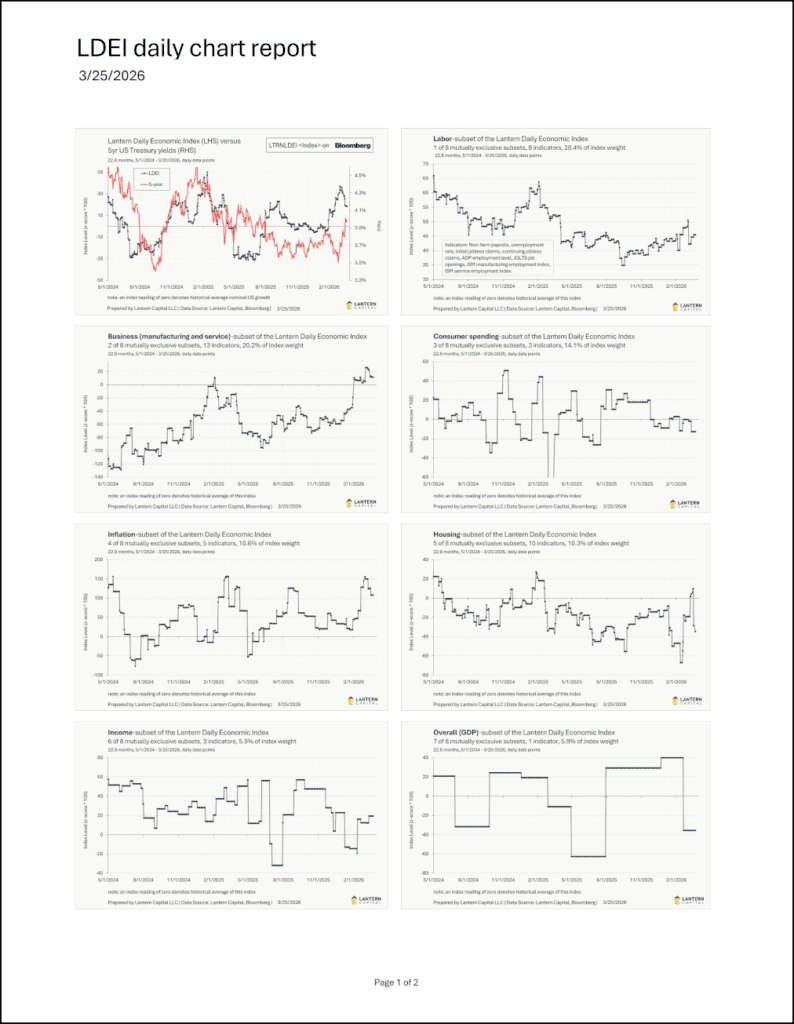
6. Daily charts report example
From 3/25/2026
7. Description
The Lantern Daily Economic Index (LDEI) measures real-time growth of all economic data segments: real, inflation, and soft sentiment/survey-based. Uniquely, economic data is applied to the index on the day it is released and combined with the rest of most-recently-released data, rather than aggregating all data for certain observation periods as other indices do. This is done to blend data with different frequencies and allow for the index’s daily calculation, but most importantly present economic data when it is known and impacts markets.
This allows the isolation of what was known about the economy between any two dates, such as how much the economy has improved since the last Fed meeting, or how well interest rates track economic data between two dates. It also represents the economic component in Treasury yields day to day. These analyses aren’t possible with existing indices.
The Aruoba-Diebold-Scotti Business Conditions Index (ADS) at the Philadelphia Fed uses just six indicators, isn’t nominal, doesn’t reflect data on release date, and has very little correlation with the LDEI. The Atlanta Fed’s GDPnow changes daily with new economic releases but uses a subset of data that directly influences real GDP; excluding inflation and most “soft” survey/sentiment data. It isolates data into calendar quarters and isn’t a continuous index. The Citi Economic Surprise Index reflects all segments of economic data daily but is half-about what economists think the numbers will be. It isn’t a direct measure of economic performance and mutes the appearance of business cycles (writing on that). And, the Chicago Fed National Activity Index (CFNAI), of which this index shares its general methodology and framework, is only calculated monthly and doesn’t include inflation data or much survey/sentiment data. 57% of the indicators in this index are not in the CFNAI. These indices leave an ambiguity about the economy which the LDEI clarifies. The LDEI isolates the economic component in Treasury yields, which helps to show which other factors are at play. Real-time economics have more sway over Treasury yields than appreciated.
The LDEI is a weighted average of 45 widely-followed economic indicators that fall into eight categories of labor, business, consumer spending, inflation, housing, income, overall (GDP), and consumer sentiment. Each sector is its own index. The index is constructed to have an average of 0 and a standard deviation of 100. Individual economic data series are transformed and normalized into comparable time-series before being averaged with subjective fixed subjective weights according to their perceived impact on markets and the economy. Included indicators are released with weekly, monthly, and quarterly frequencies. The index has been back-tested 27 years to 1998, covering three recessions including their approach and recovery. Indicators have been chosen for their renown, visibility, and duration.
The index was originally created to provide a fundamental basis to movements in U.S. Treasury yields, but it also serves as the most up-to-date and meaningful summary of nominal U.S economic performance for use by anyone interested in the economy. Free weekly updates are below and many analyses using the index are on the insights page.